
LIQUID INSTRUMENTS Moku:Go FIR Filter Builder
With the Moku:Go FIR Filter Builder, you can design and implement lowpass, high pass, bandpass, and band stop finite impulse response (FIR) filters with up to 14,819 coefficients at a sampling rate of 30.52 kHz, or 232 coefficients at a sampling rate up to 3.906 MHz. The Moku:Go Windows/macOS interface allows you to fine tune your filter’s response in the frequency and time domains to suit your specific application. Select between four frequency response shapes, five common impulse responses, and up to eight window functions.
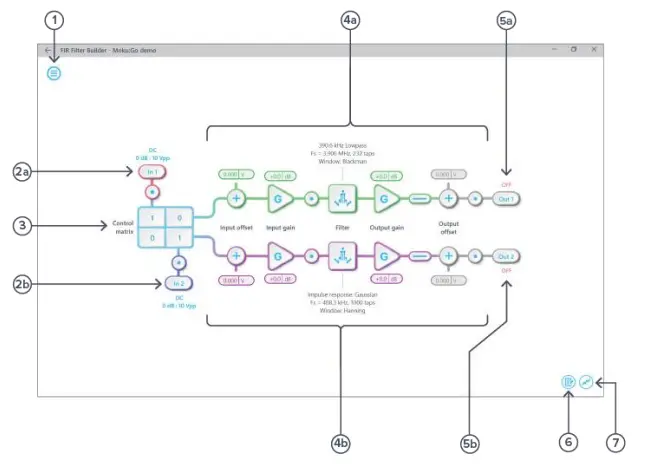
User interface
| ID | Description |
| 1 | Main menu |
| 2a | Input configuration for Channel 1 |
| 2b | Input configuration for Channel 2 |
| 3 | Control matrix |
| 4a | Configuration for FIR filter 1 |
| 4b | Configuration for FIR filter 2 |
| 5a | Output switch for FIR filter 1 |
| 5b | Output switch for FIR filter 2 |
| 6 | Enable the data logger |
| 7 | Enable the oscilloscope |
The main menu can be accessed by clicking the icon ![]() in the top-left corner.
in the top-left corner.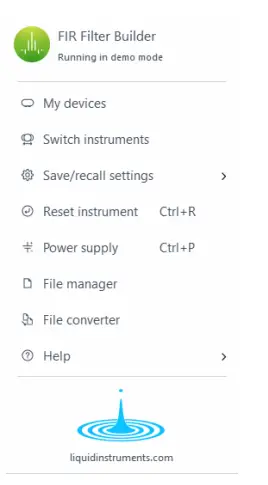
This menu provides the following options:
| Options | Shortcuts | Description |
| My devices | Return to device selection. | |
| Switch instruments | Switch to another instrument. | |
| Save/recall settings: | ||
| Ctrl/Cmd+S | Save the current instrument settings. |
| Ctrl/Cmd+O | Load the last saved instrument settings. |
| Show the current instrument settings. | |
| Reset instrument | Ctrl/Cmd+R | Reset the instrument to its default state. |
| Power supply | Access the Power Supply control window.* | |
| File manager | Open the File Manager tool.** | |
| File converter | Open the File Converter tool.** | |
| Help | ||
| Access the Liquid Instruments website. | |
| Ctrl/Cmd+H | Show the Moku:Go app shortcuts list. |
| F1 | Access the instrument manual. |
| Report a bug to Liquid Instruments. | |
| Show app version, check update, or license information. |
*Power Supply is available on the Moku:Go M1 and M2 models. Detailed information about the Power Supply can be found on page 22 of this user manual.
**Detailed information about the file manager and file converter can be found on page 21 of this user manual.
Input configuration
The input configuration can be accessed by clicking the ![]() or
or ![]() icon, allowing you to adjust the coupling and input range for each input channel.
icon, allowing you to adjust the coupling and input range for each input channel.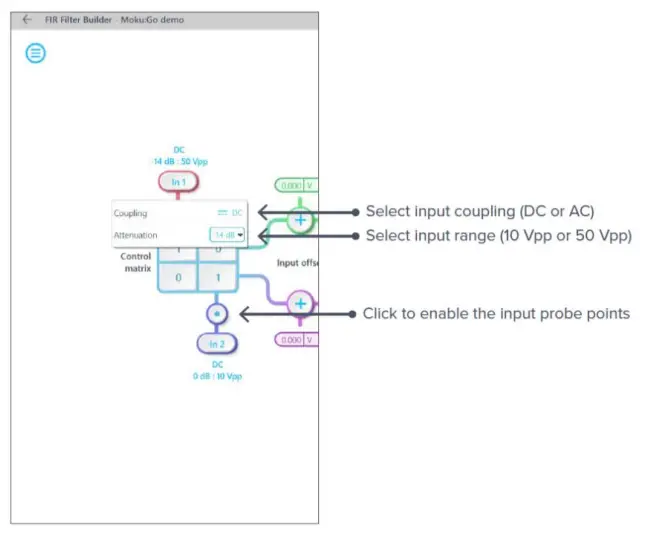
Details about the probe points can be found in the Probe Points section.
Control matrix
The control matrix combines, rescales, and redistributes the input signals to the two independent FIR filters. The output vector is the product of the control matrix multiplied by the input vector.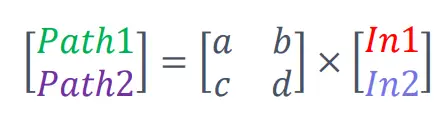
where
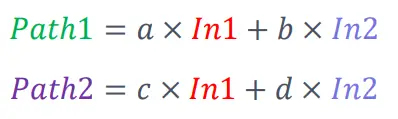
For example, a control matrix of ![]() adds Input 1 and Input 2 and routes to the top Path1 (FIR Filter 1), multiplies Input 2 by a factor of two, and then routes it to the bottom Path2 (FIR Filter 2).
adds Input 1 and Input 2 and routes to the top Path1 (FIR Filter 1), multiplies Input 2 by a factor of two, and then routes it to the bottom Path2 (FIR Filter 2).
The value of each element in the control matrix can be set between -20 to +20 with 0.1 increments when the absolute value is less than 10, or 1 increment when the absolute value is between 10 and 20. Adjust the value by clicking on the element.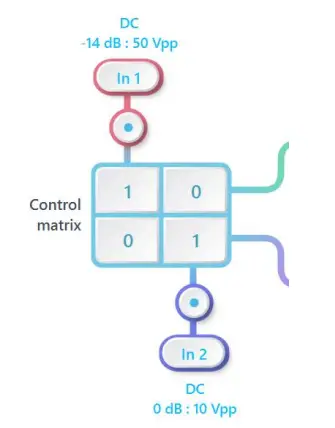
FIR Filter
The two independent, fully real-time configurable FIR filter paths follow the control matrix in the block diagram, represented in green and purple for filter 1 and 2, respectively.
User interface
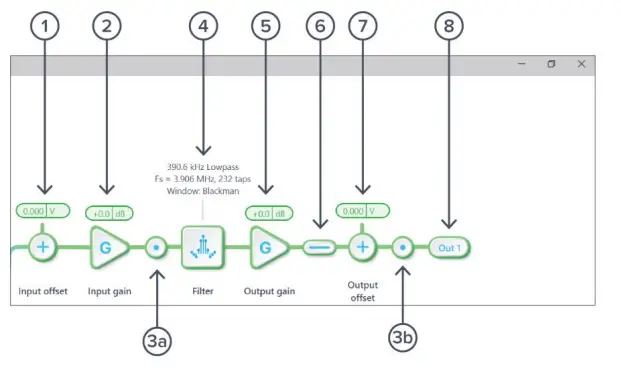
| ID | Parameter | Description |
| 1 | Input offset | Click to adjust the input offset (-2.5 to +2.5 V). |
| 2 | Input gain | Click to adjust the input gain (-40 to 40 dB). |
| 3a | Pre-filter probe | Click to enable/disable the pre-filter probe point. See Probe Points section for details. |
| 3b | Output probe | Click to enable/disable the output probe point. See Probe Points section for details. |
| 4 | FIR filter | Click to open view and configure the FIR filter builder. |
| 5 | Output gain | Click to adjust the input gain (-40 to 40 dB). |
| 6 | Output switch | Click to zero the filter output. |
| 7 | Output offset | Click to adjust the output offset (-2.5 to +2.5 V). |
| 8 | DAC switch | Click to enable/disable the Moku:Go DAC output. |
FIR Filter Builder
Builder interface
Click the ![]() icon to open the full FIR Filter Builder view.
icon to open the full FIR Filter Builder view.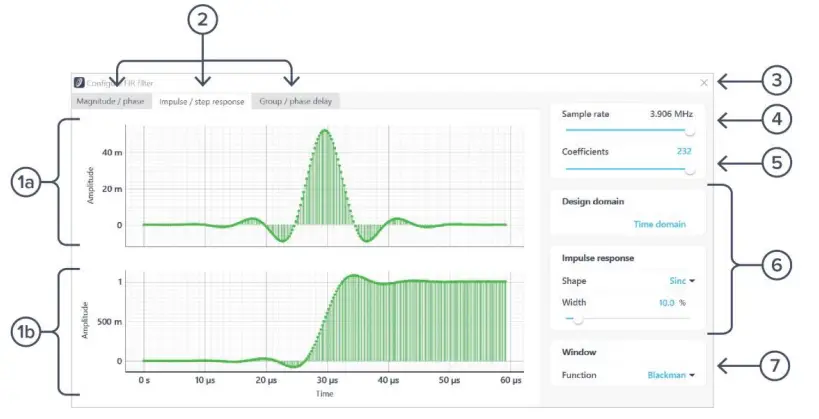
| ID | Parameter | Description |
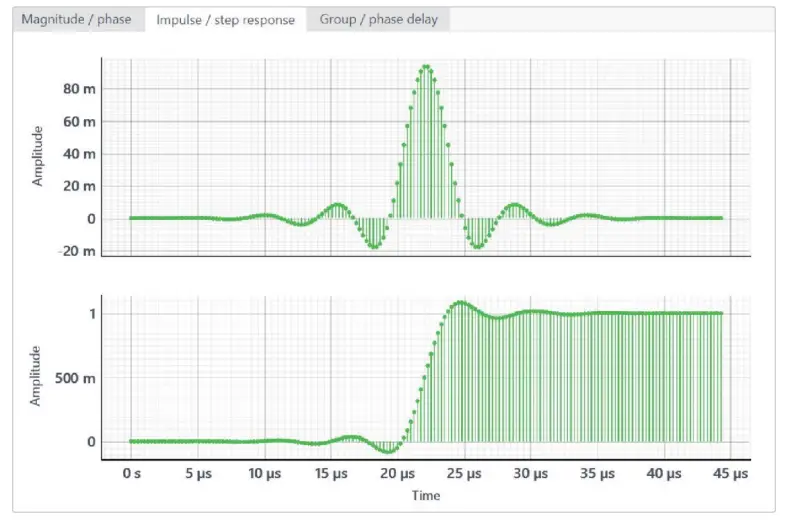
| 1a | Plot 1 | Impulse response plot. |
| 1b | Plot 2 | Step reponse plot. |
| 2 | Plot set selection | Click to select the set of plots to display in the plot area. |
| 3 | Save & close | Click to save and close the filter builder view. |
| 4 | Sampling rate | Adjust the sampling rate for the input. Slide between 30.52 kHz and 3.906 MHz. You may also use the scroll wheel on the slider to adjust it. |
| 5 | Number of coefficients | Click the number to enter or slide the slider to adjust the number of coefficients. You may also use the scroll wheel on the slider to adjust it. |
| 6 | Filter design | Configure the parameters for the FIR filter. Detailed information can be found on page 13. |
| 7 | Window function | Click to select the window function. |
Filter characteristic graphs
A set of two real-time filter characteristic plots can be shown at a time in the FIR filter builder.
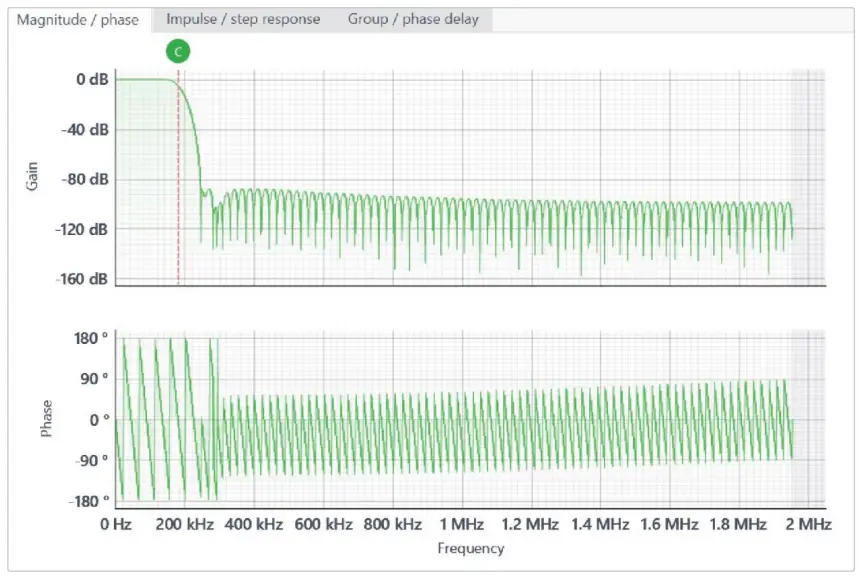
Click the plot set selection buttons to select between Magnitude/phase, Impulse/step response, and Group/phase delay plot sets. Click and drag the ![]() icon in the Magnitude/phase plot to adjust the corner frequency in real-time.
icon in the Magnitude/phase plot to adjust the corner frequency in real-time.
| Magnitude/phase | Impulse/step response | Group/phase delay | ||||
| Plot 1 | Plot 2 | Plot 1 | Plot 2 | Plot 1 | Plot 2 | |
| X – axis | Frequency (MHz) | Time (μs) | Frequency (MHz) | |||
| Y – axis | Gain (dB) | Phase (°) | Amplitude (V) | Group/phase Delay (μs) | ||
Magnitude/phase plot set:
Impulse/step reponse plot set:
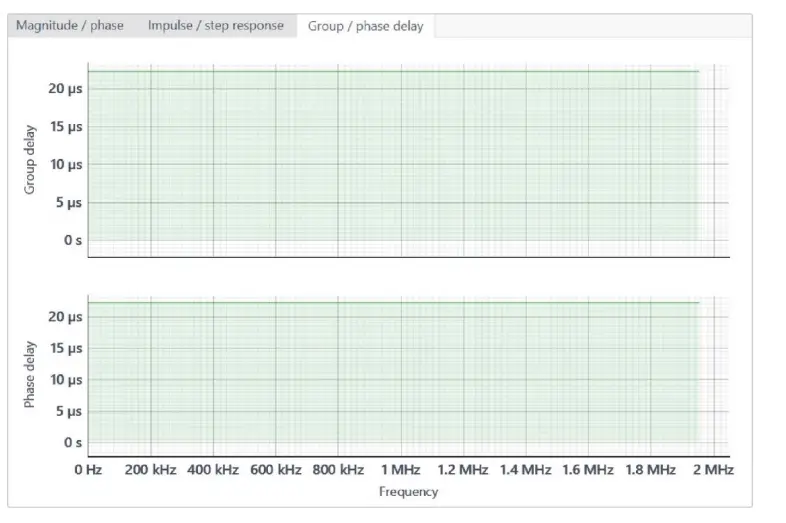
Group/phase delay plot sets:
Sampling rate/coefficients
The maximum number of coefficients depends on the chosen sampling rate. Available sampling rates with their corresponding maximum numbers of coefficients are listed in the table below.
| Sampling rate | Maximum number of coefficients |
| 30.52 kHz | 14,819 |
| 61.04 kHz | 14,819 |
| 122.1 kHz | 7,424 |
| 244.1 kHz | 3,712 |
| 488.3 kHz | 1,856 |
| 976.6 kHz | 928 |
| 1.953 MHz | 464 |
| 3.906 MHz | 232 |
Design domain
The FIR filter can be designed in either time or frequency domain. In the time domain designer, an impulse response function builder is accessible. Several predefined functions are available. Users can also enter an equation with the equation editor or load their own set of coefficients with the custom impulse response option. In the frequency domain designer, a frequency response builder is accessible. Lowpass, high pass, bandpass, and band stop filters are available with adjustable cut-off frequencies.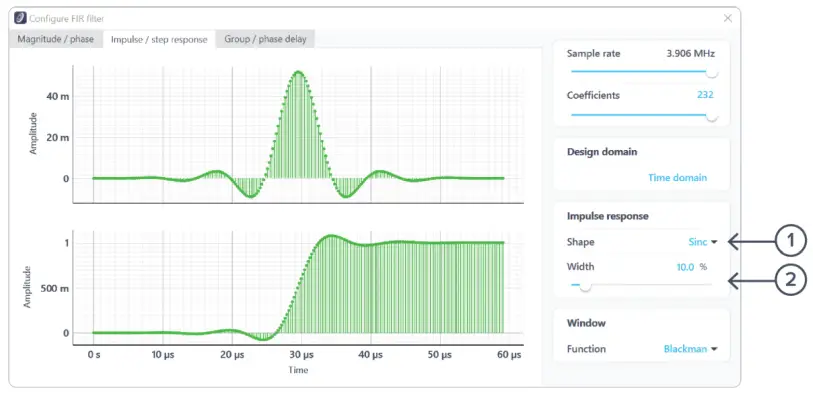
| ID | Parameter | Description |
| 1 | Impulse shape | Click to select the shape of the impulse response. |
| 2 | Impulse width | Click the number to enter or slide the slider to adjust the impulse width. |
List of available shapes:
| Shape | Note |
| Rectangular | |
| Sinc | Width adjustable from 0.1 % to 100 %. |
| Triangular | |
| Gaussian | Width adjustable from 0.1 % to 100 %. |
| Equation | Click the equation to open the equation editor. Details about the equation editor can be found in the in the Equation Editor section. |
| Custom | Details about the custom impulse response can be found in the Custom Impulse Response section. |
Coefficient quantization
Due to the limit of digitization depth, the quantization error is pronounced at certain FIR filter settings. A red coefficient quantization warning may appear on the top-right corner of the plot, and the actual response curve will be plotted in red.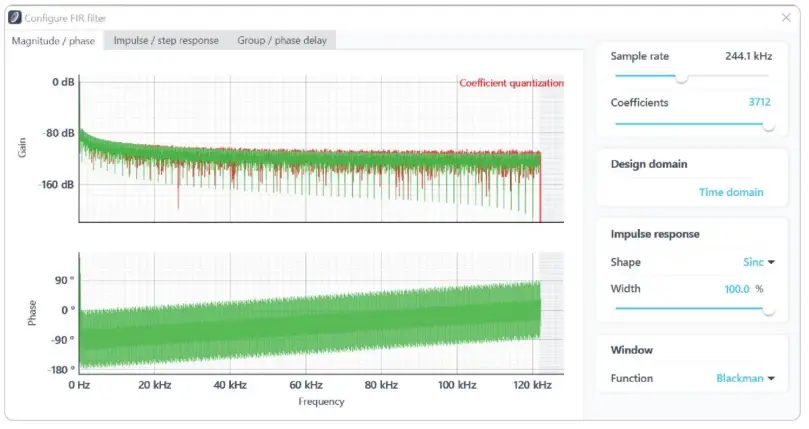
Equation editor
The equation editor allows you to define arbitrary mathematical functions for the impulse response. Select from a range of common mathematical expressions including trigonometric, quadratic, exponential, and logarithmic functions. The variable t represents time in the range from 0 to 1 periods of the total waveform. You can access recently entered equations by pressing the ![]() icon. The validity of the entered equation is indicated by the
icon. The validity of the entered equation is indicated by the ![]() and
and ![]() icons that appear to the right of the equation box.
icons that appear to the right of the equation box.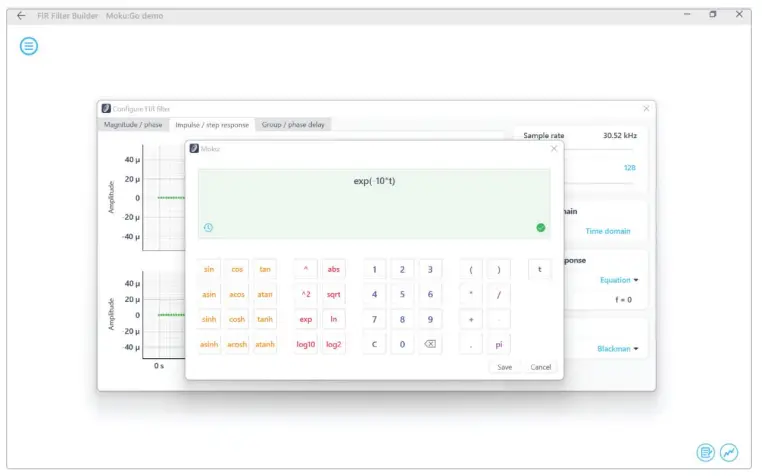
Custom impulse response
The output of the FIR filter is a weighted sum of the most recent input values:
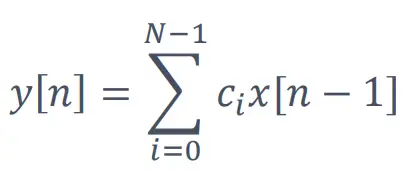
To specify a custom filter, you must supply a text file containing the filter coefficients from your computer that is connected to Moku:Go. The file can contain up to 14,819 coefficients separated by commas or new lines. Each coefficient must be in the range of [-1, +1]. Internally, these are represented as signed 25-bit fixed-point numbers, with 24 fractional bits. Filter coefficients can be computed using signal processing toolboxes in MATLAB, SciPy, etc.
Some coefficients may result in overflow or underflow, which degrade filter performance. Check filter responses prior to use.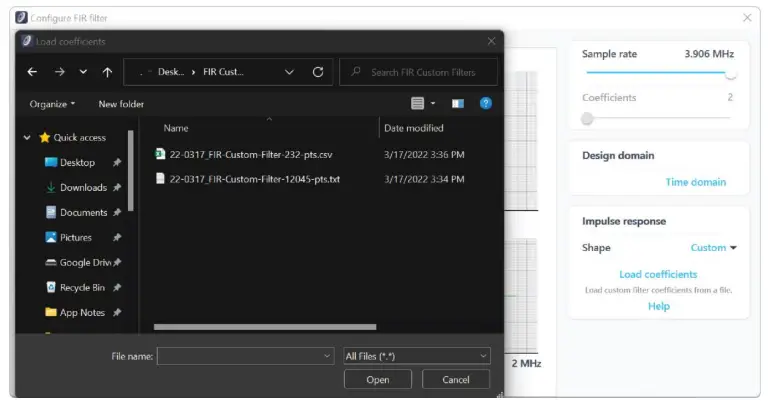
Frequency domain designer
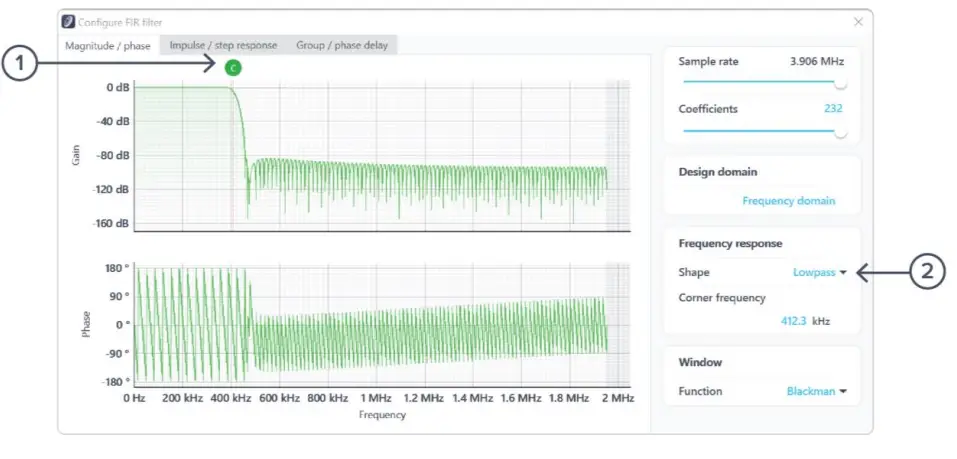
| ID | Parameter | Description |
| 1 | Cut-off cursor | Click and hold to slide in the frequency axis. |
| 2 | Frequency response design parameters | Click to select the filter shape and the corner frequencies. |
List of available shapes:
| Shape | Note |
| Lowpass | Single adjustable cursor. |
| Highpass | Single adjustable cursor. |
| Bandpass | Two adjustable cursors. |
| Bandstop | Two adjustable cursors. |
Probe points
The Moku:Go FIR Filter Builder has an integrated Oscilloscope and Data Logger that can be used to probe the signal at the input, pre-FIR filter, and output stages. The probe points can be added by clicking the ![]() icon.
icon.
Oscilloscope
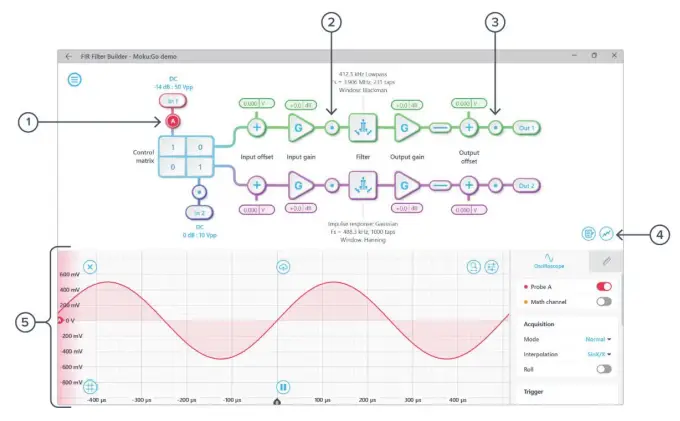
| ID | Parameter | Description |
| 1 | Input probe point | Click to place the probe point at the input. |
| 2 | Pre-FIR probe point | Click to place the probe before the FIR filter. |
| 3 | Output probe point | Click to place the probe at the output. |
| 4 | Oscilloscope/Data Logger toggle | Toggle between the integrated Oscilloscope or Data Logger. |
| 5 | Oscilloscope | Refer to the Moku:Go Oscilloscope manual for the details |
Data Logger
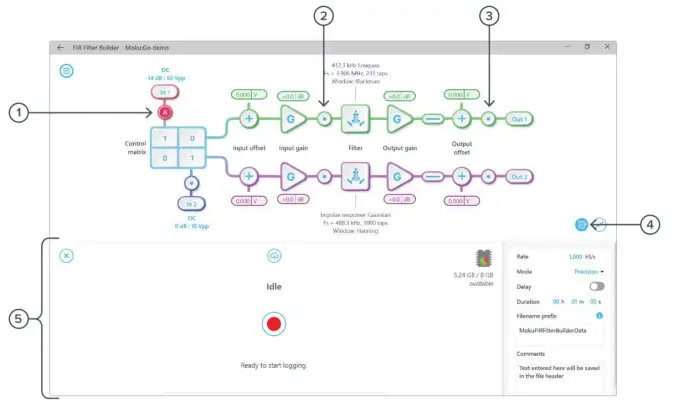
| ID | Parameter | Description |
| 1 | Input probe point | Click to place the probe point at the input. |
| 2 | Pre-FIR probe point | Click to place the probe before the FIR filter. |
| 3 | Output probe point | Click to place the probe at the output. |
| 4 | Oscilloscope/data logger toggle | Toggle between the integrated Oscilloscope or Data Logger. |
| 5 | Data Logger | Refer to the Moku:Go Data Logger manual for the details. |
It is possible to stream data directly from Moku:Go to a computer without the need to save to a .li file using the Python, MATLAB, or LabVIEW APIs. For more information on how this feature works, please refer to our API documentation site.
Additional tools
The Moku:Go app has two built-in file management tools: file manager and file converter. The file manager allows users to download the saved data from Moku:Go to a local computer, with optional file format conversion. The file converter converts the Moku:Go binary (.li) format on the local computer to either .csv, .mat, or .npy format.
File manager
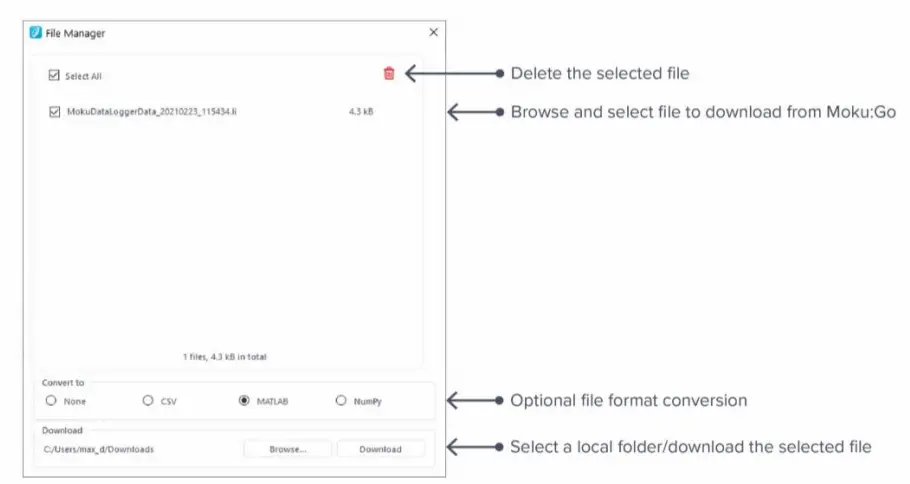
Once a file is transferred to the local computer, a icon ![]() shows up next to the file.
shows up next to the file.
File converter
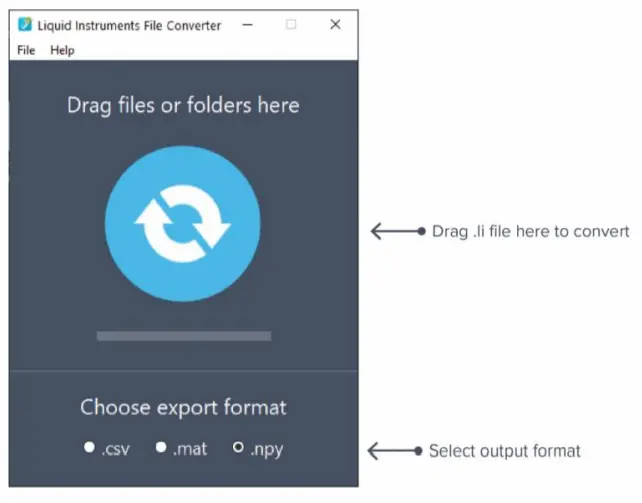
The converted file is saved in the same folder as the original file.
Liquid Instruments File Converter has the following menu options:
| Options | Shortcut | Description |
| File | ||
| Ctrl+O | Select a .li file to convert |
| Ctrl+ Shift +O | Select a folder to convert |
| Close the file converter window | |
| Help | ||
| Access Liquid Instruments website | |
| Report bug to Liquid Instruments | |
| Show app version, check update, or license information |
Power Supply
The Moku:Go Power Supply is available on M1 and M2 models. M1 features a two-channel Power Supply, while M2 features a four-channel Power Supply. Access the Power Supply control window in all instruments under the main menu.
Each Power Supply operates in two modes: constant voltage (CV) or constant current (CC) mode. For each channel, you can set a current and voltage limit for the output. Once a load is connected, the Power Supply operates either at the set current or set voltage, whichever comes first. If the Power Supply is voltage limited, it operates in the CV mode. If the Power Supply is current limited, it operates in the CC mode.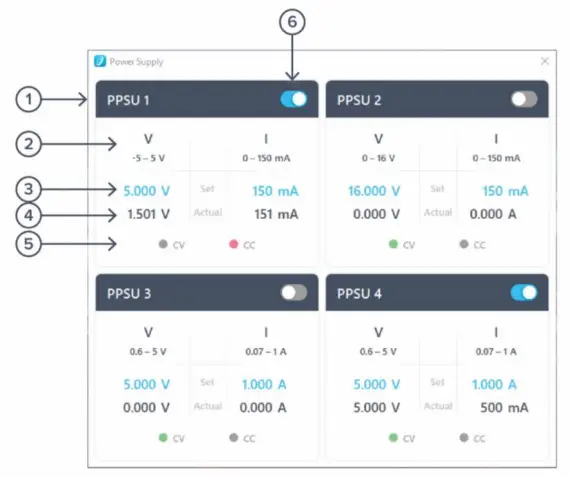
| ID | Function | Description |
| 1 | Channel name | Identifies the Power Supply being controlled. |
| 2 | Channel range | Indicates the voltage/current range of the channel. |
| 3 | Set value | Click the blue numbers to set the voltage and current limit. |
| 4 | Readback numbers | Voltage and current readback from the Power Supply; the actual voltage and current being supplied to the external load. |
| 5 | Mode indicator | Indicates if the Power Supply is in CV (green) or CC (red) mode. |
| 6 | On/Off toggle | Click to turn the Power Supply on and off. |
Ensure Moku:Go is fully updated. For the latest information: