LIQUID INSTRUMENTS Moku:Go Frequency Response Analyzer User Manual
Moku:Go’s Frequency Response Analyzer can be used to measure a system’s frequency response from 10 mHz up to 30 MHz.
Frequency Response Analyzers are commonly used to measure the transfer functions of electrical, mechanical or optical systems by injecting a swept sinewave into the system and then comparing the output voltage to the input voltage. The resulting measurements of the system’s magnitude and phase response can be used to optimise the closed-loop response of control systems, characterize resonant behaviour in non-linear systems, design filters, or measure the bandwidth of different electronic components. Frequency Response Analyzers are quite simply an indispensable tool in any electronics lab.
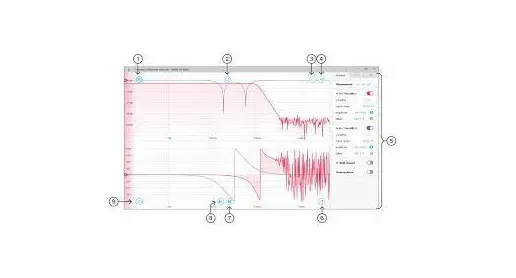
User Interface
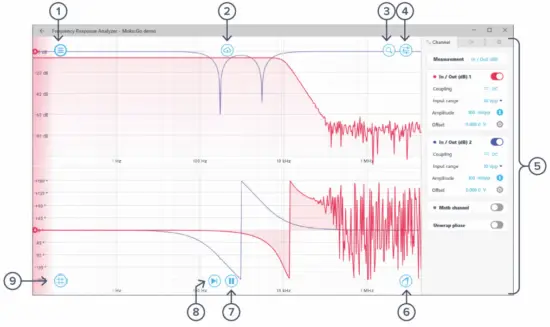
ID | Description | ID | Description |
| 1 | Main menu | 6 | Normalization* |
2 | Export data | 7 | Single/continuous mode switch* |
| 3 | Signal display navigation | 8 | Start / pause sweep* |
4 | Settings | 9 | Cursors |
| 5 | Control pane |
*Detailed information can be found in the Sweep mode section.
The main menu can be accessed by clicking the ![]() icon on the top-left corner.
icon on the top-left corner.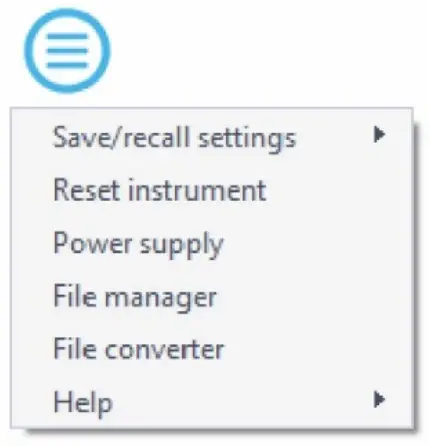
This menu provides the following options:
Options | Shortcuts | Description |
| Save/recall settings: | ||
| Save instrument state | Ctrl+S | Save the current instrument settings. |
| Load instrument state | Ctrl+O | Load last saved instrument settings. |
| Show current sate | Show the current instrument settings. | |
| Reset instrument | Ctrl+R | Reset the instrument to its default state. |
| Power supply | Access power supply control window.* | |
| File manager | Open file manager tool. | |
| File converter | Open file converter tool. | |
| Help | ||
| Liquid Instruments website | Access Liquid Instruments website. | |
| Shortcuts list | Ctrl+H | Show Moku:Go app shortcuts list. |
| Manual | F1 | Access instrument manual. |
| Report an issue | Report bug to Liquid Instruments. | |
| About | Show app version, check update, or license |
Power supply is available on Moku:Go M1 and M2 models. Detailed Information about power supply can be found in Moku:Go power supply manual.
Export data
The export data options can be accessed by clicking the ![]() icon, allowing you to:
icon, allowing you to: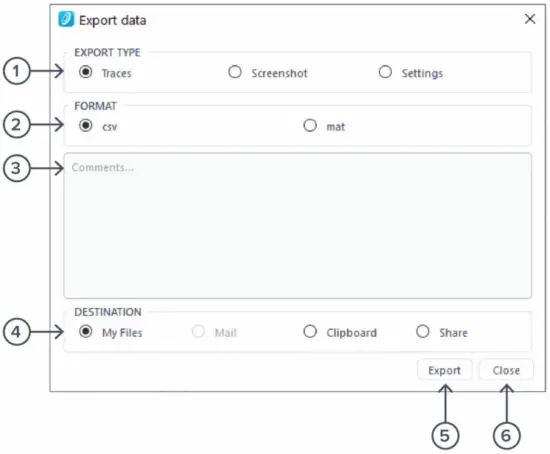
Description
- Select the type of data to export.
- Select the file format (CSV or MAT).
- Enter additional comments for the saved file.
- Select the exporting location on your local computer.
- Click to execute data export.
- Click to close the export data window.
Signal display position
The displayed signal can be moved around the screen by clicking anywhere on the signal display window and dragging to the new position. The cursor will turn into a ![]() icon once clicked, drag horizontally to shift along the frequency axis and drag vertically to shift along the amplitude/power axis.
icon once clicked, drag horizontally to shift along the frequency axis and drag vertically to shift along the amplitude/power axis.
The signal display can also be moved hotizontally and vertically with arrow keys.
Display scale and zoom
Scrolling the mouse wheel zooms in and out along the primary axis. Access the scroll setting by hovering the cursor over the ![]() icon.
icon.
Icons | Description |
| Assign the horizonal axis as the primary axis. |
 | Assign the vertical axis as the primary axis |
| Rubber band zoom: hold the primary mouse button to draw a region to zoom-in, release the button to execute. |


Additional keyboard combinations are also available.
Actions | Description |
| Ctrl + Scroll Wheel | Zoom secondary axis |
| +/- | Zoom primary axis with keyboard |
| Ctrl +/- | Zoom secondary axis with keyboard. |
| Shift + Scroll Wheel | Zoom primary axis towards the center. |
| Ctrl + Shift + Scroll Wheel | Zoom secondary axis towards the center. |
| R | Rubber band zoom. |
Auto scale
Double click anywhere on the signal display window to auto scale the traces.
Settings
The instrument control menu allows you to configure the Frequency Response Analyzer for your measurement, which will vary depending on the specific characteristics of the system under test.
Access the instrument Control menu by clicking the ![]() icon.
icon.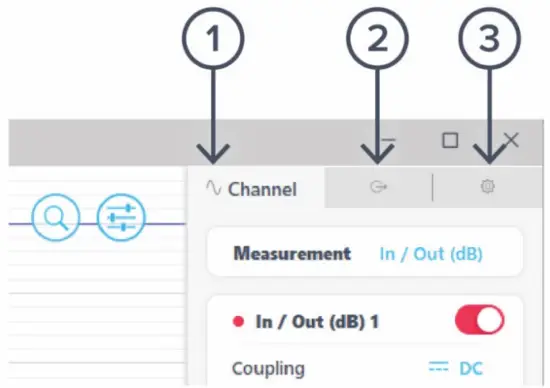
ID | Description |
1 | Channel |
2 | Swept sine |
| 3 | Advanced |
Channels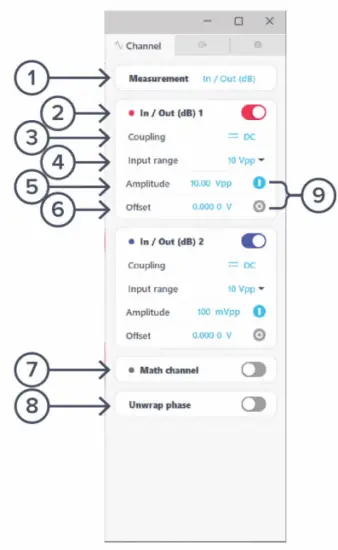
ID | Description | ID | Description |
| 1 | Select to display In (dBm) or In/Out (dB) | 6 | Swept sine (output) offset |
| 2 | Toggle channel on/off | 7 | Enable/disable Math channel |
| 3 | Select AC or DC coupling | 8 | Unwrap/wrap phase |
| 4 | Select input range 10 Vpp or 50 Vpp | 9 | Turn on/off amplitude and/or offset |
| 5 | Swept sine (output) amplitude |
Math channel
- Select between addition, subtraction, multiplication and division of the two channels.
- Compare transfer functions of channel 1 and 2 by configuring them identically.
Unwrap phase
- Phase is measured as a modulo of 2p. Enabling unwrapping will display an estimate of the total accumulated phase of the system.
Swept Sine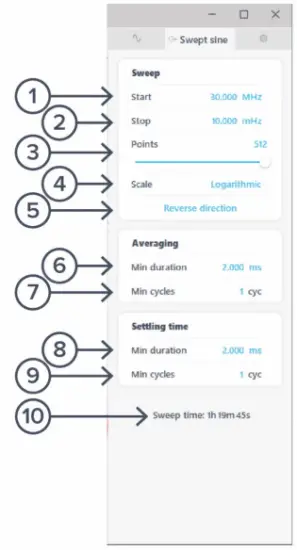
ID | Description | ID | Description |
| 1 | Configure the sweep start frequency | 6 | Configure the minimum averaging time |
| 2 | Configure the sweep stop frequency | 7 | Configure the minimum averaging cycles |
| 3 | Select the number of sweep point | 8 | Configure the minimum settling time |
| 4 | Select Linear or Log scale | 9 | Configure the minimum settling cycles |
| 5 | Reverse sweep direction | 10 | Total sweep time based on selected parameters |
Sweep points
- Increasing the number of points in the sweep increases frequency resolution of the measurement allowing narrower features to be detected over a wider frequency range but will increase the total measurement duration.
Sweep scale
- The discrete points in the swept sine output can be spaced linearly or logarithmically. Logarithmic sweeps provide greater measurement resolution at lower frequencies.
Averaging
- Measurements at each point in the frequency sweep are averaged to improve accuracy and precision. You can configure the period over which each measurement is averaged to control the signal-to-noise ratio (SNR). Longer averaging times result in higher SNRs, allowing small features to be detected with greater precision. Shorter averaging times result in lower SNR measurements but the reduce total sweep time.
- The total averaging time is determined based on the minimum duration and minimum number of cycles over which each point in the sweep is averaged. Moku:Go’s Frequency Reference Analyzer averages for the greater of the two values rounded upto the nearest number of integer cycles in order to avoid spectral leakage.
Settling time
- The settling time determines how long the Frequency Reference Analyzer waits before performing measurements at each frequency in the sweep. Settling time is important when characterizing resonant systems with high Q-factors in order to allow excitations to ‘settle’ between measurements. It can also be used to account for transmission delays in cables. When measuring a non-resonant system, the settling time should be set to equal the total propagation delay through the system.
- The total settling time is determined based on the minimum duration and minimum number of cycles over which the instrument will wait before beginning a measurement at each frequency in the sweep. The Frequency Response Analyzer will wait for the greater effective duration of the two settings before beginning a measurement at each point in the sweep.
Advanced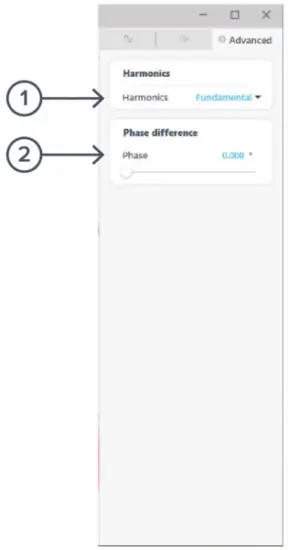
ID | Description |
| 1 | Set the harmonic to demodulate for the frequency response |
2 | Set the phase difference between the output and local oscillator |
Normalization
Moku:Go’s Frequency Reference Analyzer features a Normalization tool ![]() that can be used to normalize subsequent measurements. Normalization is useful when compensating for cable delays and comparing different devices under test.
that can be used to normalize subsequent measurements. Normalization is useful when compensating for cable delays and comparing different devices under test.
Clicking the ![]() icon will bring up the Normalization menu. Re-normalize will replace the current Normalization trace with a new one. Remove Normalization will erase all stored Normalization settings and cannot be undone.
icon will bring up the Normalization menu. Re-normalize will replace the current Normalization trace with a new one. Remove Normalization will erase all stored Normalization settings and cannot be undone.
Sweep modes
Single
Clicking the ![]() icon will enable single sweep mode, which will pause the swept sine source at the end of the next full sweep. The swept sine signal will be turned off after the sweep completes and displayed data will not be updated.
icon will enable single sweep mode, which will pause the swept sine source at the end of the next full sweep. The swept sine signal will be turned off after the sweep completes and displayed data will not be updated.
Continuous
Clicking the ![]() icon will enable continuous sweep mode, which will perform a new measurement as soon as the previous one has finished. This mode is commonly used to monitor systems with transfer functions that may change over time (e.g., control loops).
icon will enable continuous sweep mode, which will perform a new measurement as soon as the previous one has finished. This mode is commonly used to monitor systems with transfer functions that may change over time (e.g., control loops).
Pause / Restart
Clicking the ![]() icon will immediately pause the current sweep. While paused, you can zoom in on features for more details, but no new data will be captured. Pressing the icon will also pause capture.
icon will immediately pause the current sweep. While paused, you can zoom in on features for more details, but no new data will be captured. Pressing the icon will also pause capture.
clicking the ![]() or
or ![]() icons will restart the sweep.
icons will restart the sweep.
Cursors
Cursors can be accessed by clicking the ![]() icon, allowing you to add power or frequency cursors, or remove all cursors. In addition, you can click and hold the cursors icon, and drag horizontally to add a frequency cursor, or drag vertically to add a magnitude or phase cursor.
icon, allowing you to add power or frequency cursors, or remove all cursors. In addition, you can click and hold the cursors icon, and drag horizontally to add a frequency cursor, or drag vertically to add a magnitude or phase cursor.
User Interface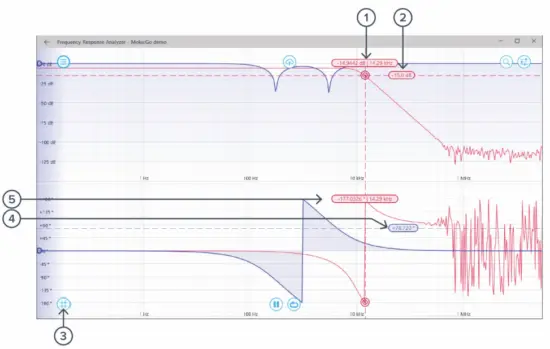
ID | Cursor item | Description |
1 | Frequency/Tracking cursor | Drag to reposition the cursor (Gray – Unattached, Red – channel 1, Blue – channel 2, Yellow – math). |
| 2 | Amplitude cursor | Drag to reposition, right click to set magnitude manually & other options. |
3 | Create cursor | Cursor options. |
| 4 | Phase cursor | Drag to adjust, right click to set phase manually & other options |
5 | Cursor label | Label depicting frequency, magnitude and phase of cursor. Drag to reposition. |
Frequency Cursor
Right-click (secondary click) to reveal frequency cursor options: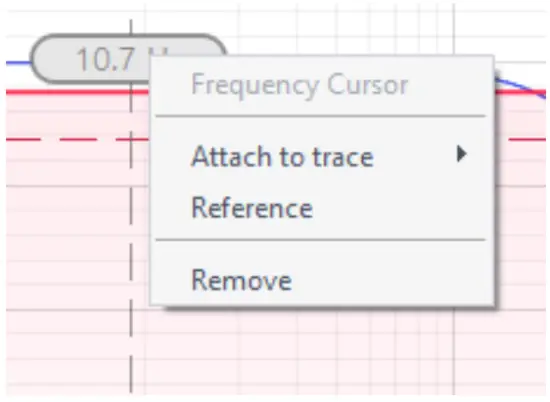
Options | Description |
| Frequency Cursor | Cursor type. |
| Attach to trace | Choose to attach the frequency cursor to channel A, channel B, or the math channel. Once the cursor is attached to a channel, it becomes to a tracking cursor. |
| Reference | Set the cursor as the reference cursor. All other cursors in the same domain and channel measure the offset to the reference cursor. |
| Remove | Remove the frequency cursor |
Tracking Cursor
Once a frequency cursor is attached to a channel, it becomes to a tracking cursor. It displays the frequency and power level of the signal at the set frequency.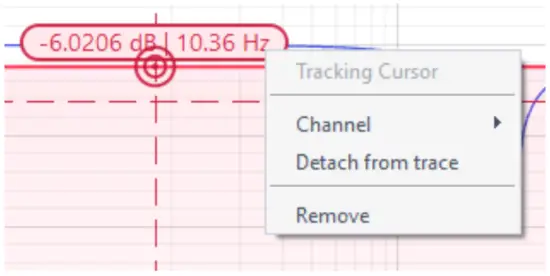
Options | Description |
| Tracking Cursor | Cursor type. |
| Channel | Assign tracking cursor to a specific channel |
| Detach from trace | Detach the tracking cursor from the channel to a frequency cursor. |
| Remove | Remove the tracking cursor |
Magnitude/Phase Cursor
Right-click (secondary click) to reveal power cursor options: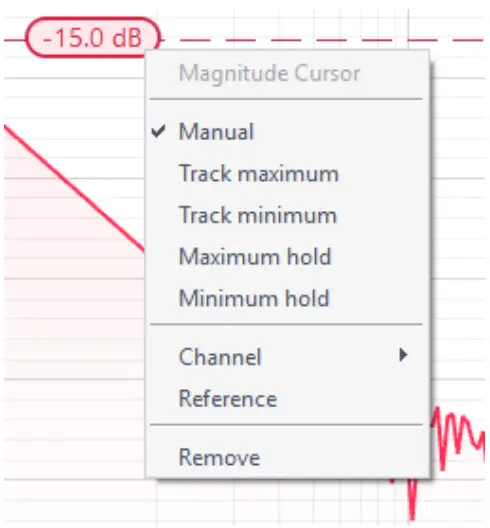
Options | Description |
| Manual | Manually set the vertical position of the cursor. |
| Track minimum | Track the maximum magnitude/phase. |
| Track minimum | Track the minimum magnitude/phase. |
| Maximum hold | Set the cursor to hold at the maximum magnitude/phase level. |
| Maximum hold | Set the cursor to hold at the minimum magnitude/phase level. |
| Channel | Assign the power cursor to a specific channel. |
| Reference | Set the cursor as the reference cursor. |
| Remove | Remove the magnitude/phase cursor. |
Additional Tools
Moku:Go app has two built-in file management tools: file manager and file converter
File Manager
The file manager allows the user to download the saved data from Moku:Go to local computer, with optional file format conversion.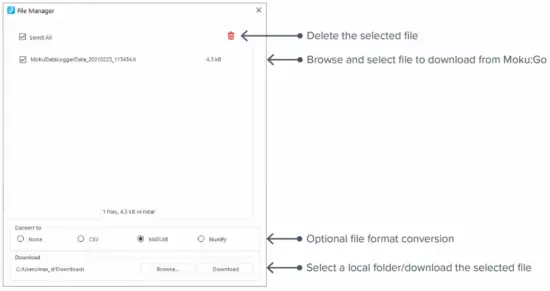
Once a file is transferred to the local computer, a ![]() icon shows up next to the file.
icon shows up next to the file.
File Converter
The file converter converts the Moku:Go’s binary (.li) format on the local computer to either .csv, .mat, or .npy format.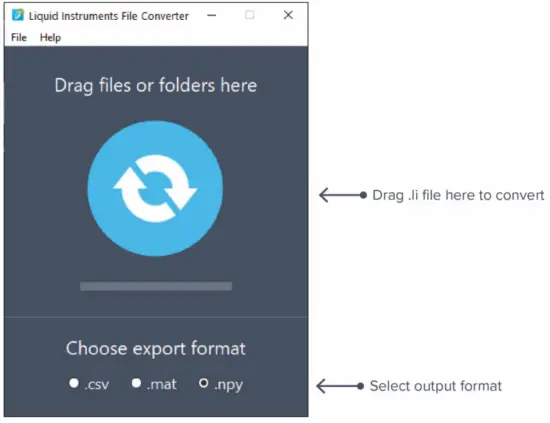
The converted file is saved in the same folder as the original file.
Liquid Instruments File Converter has the following menu options:
Options | Shortcut | Description | |
| File | |||
| · | Open file | Ctrl+O | Select a .li file to convert |
| · | Open folder | Ctrl+Shift+O | Select a folder to convert |
| · | Exit | Close the file converter window | |
| Help | |||
| · | Liquid Instruments website | Access Liquid Instruments website | |
| · | Report an issue | Report bug to Liquid Instruments | |
| · | About | Show app version, check update, or license | |
Power Supply
Moku:Go Power supply is available on M1 and M2 models. M1 features a 2-channel power supply, while M2 features a 4-channel power supply. The power supply control window can be accessed in all instruments under the main menu.
The power supply operates in two modes: constant voltage (CV) or constant current (CC) mode. For each channel, the user can set a current and voltage limit for the output. Once a load is connected, the power supply operates either at the set current or set voltage, whichever comes first. If the power supply is voltage limited, it operates in the CV mode. If the power supply is current limited, it operates in the CC mode.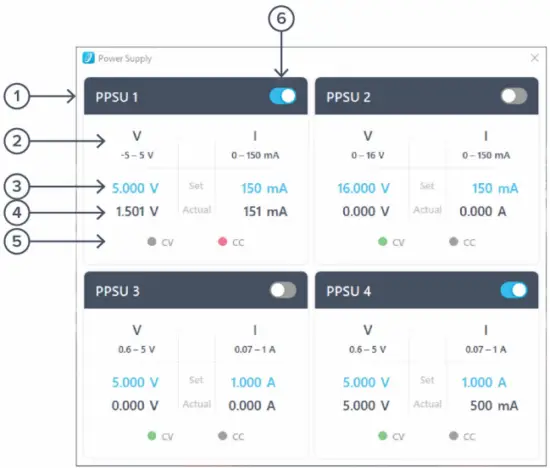
ID | Function | Description |
| 1 | Channel name | Identifies the power supply being controlled. |
| 2 | Channel range | Indicates the voltage/current range of the channel. |
| 3 | Set value | Click the blue numbers to set the voltage and current limit. |
| 4 | Readback numbers | Voltage and current readback from the power supply, the actual voltage and current being supplied to the external load. |
| 5 | Mode indicator | Indicates if the power supply is in CV (green) or CC (red) mode. |
| 6 | On/Off Toggle | Click to turn the power supply on and off. |
Ensure Moku:Go is fully updated. For the latest information:
www.liquidinstruments.com


