![]()
S3302 Series Handheld Spectrum Analyzer
User Manual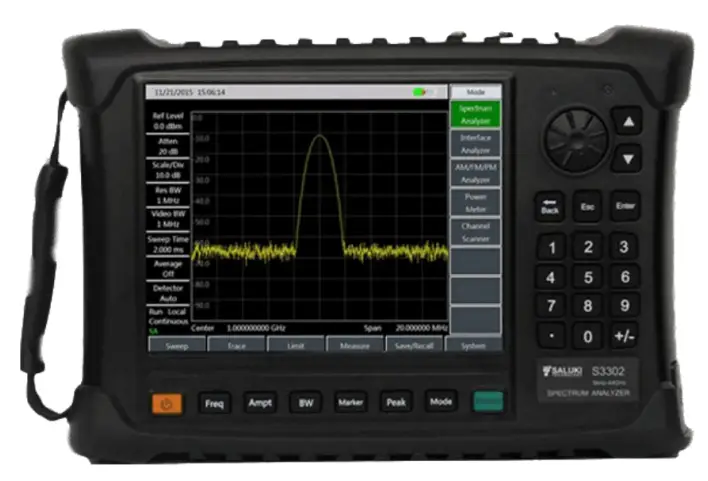
Saluki Technology Inc.
S3302 Series Spectrum Analyzer
The document applies to the handheld spectrum analyzers of the following models:
- S3302SA handheld spectrum analyzer (9kHz-4GHz).
- S3302SB handheld spectrum analyzer (9kHz-6.5GHz).
- S3302SC handheld spectrum analyzer (9kHz-9GHz).
- S3302A handheld spectrum analyzer (9kHz-20GHz).
- S3302B handheld spectrum analyzer (9kHz-26.5GHz).
- S3302C handheld spectrum analyzer (9kHz-32GHz).
- S3302D handheld spectrum analyzer (9kHz-44GHz).
- S3302E handheld spectrum analyzer (9kHz-50GHz).
- S3302F handheld spectrum analyzer (9kHz-67GHz).
Standard pack and accessories:
| No. | Item |
| 1 | Main Machine |
| 2 | Power cord |
| 3 | Power adapter |
| 4 | U disk (manual) |
| 5 | USB cable |
| 6 | Battery |
Options of the S3302 series in addition to standard accessories:
| Model No. | Description | Note |
| S3302-05 | Programming manual | / |
| S3302-06 | Power adapter | / |
| S3302-07 | Rechargeable lithium-ion battery | / |
| S3302-08 | CAT5 LAN cable | Point to point, 2m |
| S3302-09 | Micro SD card | Capacity: 8GB |
| S3302-10 | GPS option | GPS Exposed Antenna(BNC), Built-In GPS Module and Software |
| S3302-11 | USB power meter option | Provide USB Power Measurement function (Option 12-15 needed) |
| S3302-12 | S87230 USB power continuous wave power sensor (9kHz – 6GHz) | Need option 11 |
| S3302-13 | S87231 USB power continuous wave power sensor (10MHz – 18GHz) | Need option 11 |
| S3302-14 | S87232 USB power continuous wave power sensor (50MHz – 26.5GHz) | Need option 11 |
| S3302-15 | S87233 USB power continuous wave power sensor (50MHz – 40GHz) | Need option 11 |
| S3302-16 | Interference analyzer option | Waterfall, RSSI |
| Model No. | Description | Note |
| S3302-17 | AM/FM/PM analyzer option | To Realize Modulation Characteristics Analysis of AM/FM/PM Signals. |
| S3302-18 | Channel scanner option | To Realize Signal Power Measurement of Multiple Channels and Frequency. |
| S3302-19 | List sweep option | To Realize Continuous Sweep Measurement of Various Frequency Bands . |
| S3302-20 | Zero span IF output | Output the third(3rd.) IF(140.25MHz) or fourth(4th.) IF(31.25MHz) signal |
| S3302-21 | ZE9080A Directional antenna | 9kHz-20MHz, N (f) (need option 25 ) |
| S3302-22 | ZE9080B Directional antenna | 20MHz-200MHz, N (f) (need option 25 ) |
| S3302-23 | ZE9080C Directional antenna | 200MHz-500MHz, N (f) (need option 25) |
| S3302-24 | ZE9080D Directional antenna | 500MHz-8GHz, N (f) (need option 25) |
| S3302-25 | ZE9080 Antenna amplifier | 9kHz-8GHz, N (f), for option 21-24 |
| S3302-26 | S89901 Horn antenna | 1GHz – 18GHz, N(f) (do not need amplifier) |
| S3302-27 | S89902 Horn antenna | 18GHz – 40GHz, 2.92mm(f) (do not need amplifier) |
| S3302-28 | Functional bag | / |
| S3302-29 | Backpack | / |
| S3302-30 | Carrying case | For safety carrying |
| S3302-31 | S89901 antenna handle | Need option 26 |
| S3302-32 | S89902 antenna handle | Need option 27 |
| S3302-33 | Signal analyzer | To realize the rapid analysis of interference signal, and provide the audio output and IQ Capture. |
| S3302-34 | Field strength option | Provide Pscan, Fscan, MScan etc. Functions |
| S3302-35 | Tracking generator (100kHz – 4GHz) | For S3302SA only |
| S3302-36 | Tracking generator (100kHz – 6.5GHz) | For S3302SB only |
| S3302-37 | Tracking generator (100kHz – 9GHz) | For S3302SC only |
| S3302-38 | Orientation analysis option | Built-In software( need option10, 50 and directional Antenna) |
| S3302-39 | Coverage map option | Built-In software(need option10) |
| S3302-41 | Portable omnidirectional antenna | Frequency range :700MHz – 2.7GHz (for communication bands) |
| S3302-42 | 700MHz – 4GHz directional antenna | Active log-periodic antenna |
| S3302-43 | 700MHz – 6GHz directional antenna | Active log-periodic antenna |
| S3302-44 | 680MHz – 10GHz directional antenna | Active log-periodic antenna |
| S3302-45 | 680MHz – 20GHz directional antenna | Active log-periodic antenna |
| S3302-46 | 400MHz – 4GHz directional antenna | Active log-periodic antenna |
| S3302-47 | 400MHz – 6GHz directional antenna | Active log-periodic antenna |
| S3302-48 | 380MHz – 10GHz directional antenna | Active log-periodic antenna |
| S3302-49 | 380MHz – 20GHz directional antenna | Active log-periodic antenna |
| S3302-50 | External electric compass | External USB electric compass (need option38) |
| Model No. | Description | Note |
| S3302-51 | 6GHz omnidirectional antenna (680MHz – 6GHz) | Portable omnidirectional antenna |
| S3302-52 | 8GHz omnidirectional antenna (300MHz – 8GHz) | Portable omnidirectional antenna |
| S3302-53 | VHF/UHF portable antenna | Frequency range :140MHz/430MHz |
| S3302-54 | Passive directional antenna (700MHz – 4GHz) | Passive log-periodic antenna |
| S3302-55 | Passive directional antenna (700MHz – 6GHz) | Passive log-periodic antenna |
| S3302-56 | Passive directional antenna (680MHz – 10GHz) | Passive log-periodic antenna |
| S3302-57 | Passive directional antenna (680MHz – 18GHz) | Passive log-periodic antenna |
| S3302-58 | Passive directional antenna (680MHz – 25GHz) | Passive log-periodic antenna |
| S3302-59 | Passive directional antenna (680MHz – 35GHz) | Passive log-periodic antenna |
| S3302-60 | N/SMA-JJ RF cable (2m) | N male to SMA male RF coaxial cable, DC-18GHz, Length 2m |
| S3302-61 | N/SMA-JJ RF cable (1m) | N male to SMA male RF coaxial cable, DC-18GHz, Length 1m |
| S3302-67 | ZE9080 Antenna transport box | Used for antenna and amplifier, including option 21, 22, 23, 24, 25 |
Preface
Thanks for choosing S3302 series spectrum analyzer produced by Saluki Technology Inc. Please read this maintenance manual carefully for your convenience.
We devote ourselves to meeting your demands, providing you high-quality measuring instrument and the best after-sales service. We persist with “superior quality and considerate service”, and are committed to offering satisfactory products and service for our clients.
Manual No.
S3302-03-03
Version
Rev01 2019.05
Saluki Technology
Manual Authorization
The information contained in this Maintenance Manual is subject to change without notice. The power to interpret the contents of and terms used in this Manual rests with Saluki. Saluki Tech owns the copyright of this document which should not be modified or tampered by any organization or individual, or reproduced or transmitted for the purpose of making profit without its prior permission, otherwise Saluki will reserve the right to investigate and affix legal liability of infringement.
Product Quality Certificate
The product meets the indicator requirements of the manual at the time of delivery. Calibration and measurement are completed by the measuring organization with qualifications specified by the state, and relevant data are provided for reference.
Quality/Environment Management
Research, development, manufacturing and testing of the product comply with the requirements of the quality and environmental management system.
Chapter 1 Product Overview
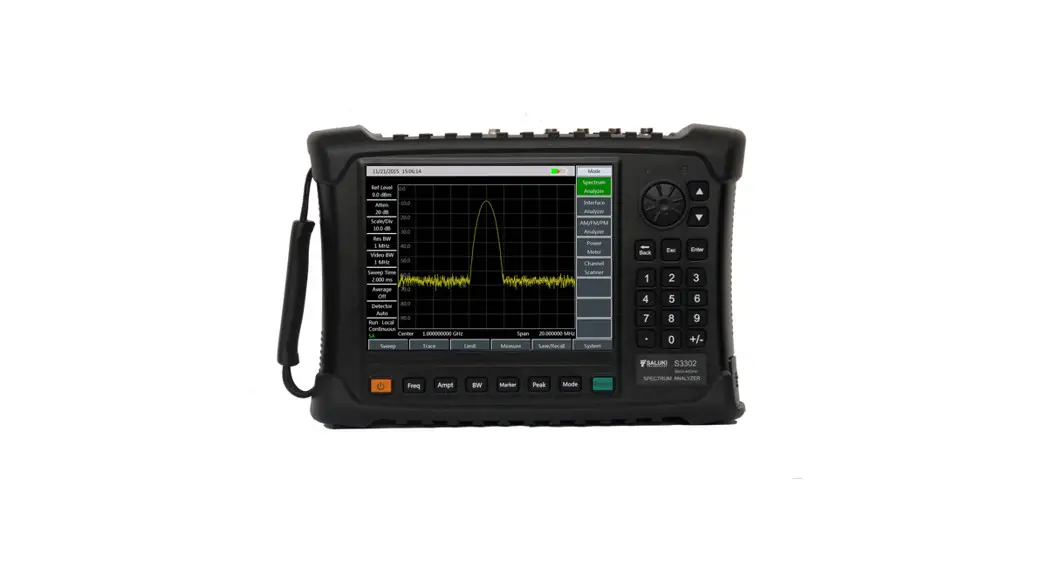
The S3302 series spectrum analyzer embraces such advantages as wide working frequency band, high performance indexes, high sweep speed, multiple test functions and easy operation. The integration of 8.4 inch LCD and capacitive touch screen improves the display definition and operation convenience. The portable structure with small volume, light weight, flexible power supply and convenient maneuverability makes it very suitable for on-site use.
Key Features:
- Wide frequency range: 9 kHz – 67 GHz, with 9 models
- Extremely low displayed average noise level: Up to -163 dBm@1 Hz RBW (typical value)
- Excellent phase noise performance: -106 dBc/Hz@100 kHz frequency offset@1 GHz carrier
- High sweep speed: Min. sweep time at 1 GHz span <20 ms
- Resolution bandwidth: 1 Hz – 10 MHz
- Preamplifier in full frequency band: Standard configuration
- Multiple measurement function modes: Spectrum analysis, interference analysis (waterfall plot, RSSI), simulation demodulation (AM/FM/PM), channel sweep, high-precision USB power measurement, etc.
- Multiple intelligent measurement functions: Field intensity measurement, channel power, occupied bandwidth, adjacent channel power, audio demodulation, carrier-to-noise ratio, emission mask, etc.
- Multiple auxiliary test interfaces: 10 MHz reference input/output interface, GPS antenna interface, zero span IF output interface, external trigger input interface, etc.
- Convenient and fast user operation experience: 8.4 inch large screen of high brightness LCD and large font display, integrated with capacitive touch screen, allowing convenient operation and multiple display modes, etc.
- Working temperature range: -10℃ – 50℃.
- Power supply: battery or adapter.
Typical Applications:
- On-site comprehensive performance evaluation of electronic weapon equipment
- On-site test and diagnosis of transmitter and receiver
- Broadband spectrum monitoring, interference identification
Chapter 2 Working Principle
The S3302 series spectrum analyzer consists of 4 mutually independent function modules with standard interfaces, namely microwave/millimeter-wave frequency conversion module, frequency synthesis module, IF signal processing module, and data processing, display and control module. Such a design facilitates maintenance of the main unit and replacement of the parts, and also significantly reduces the re-debugging workload of the main unit after the module replacement. The hardware scheme of the main unit is as shown in Fig.1.
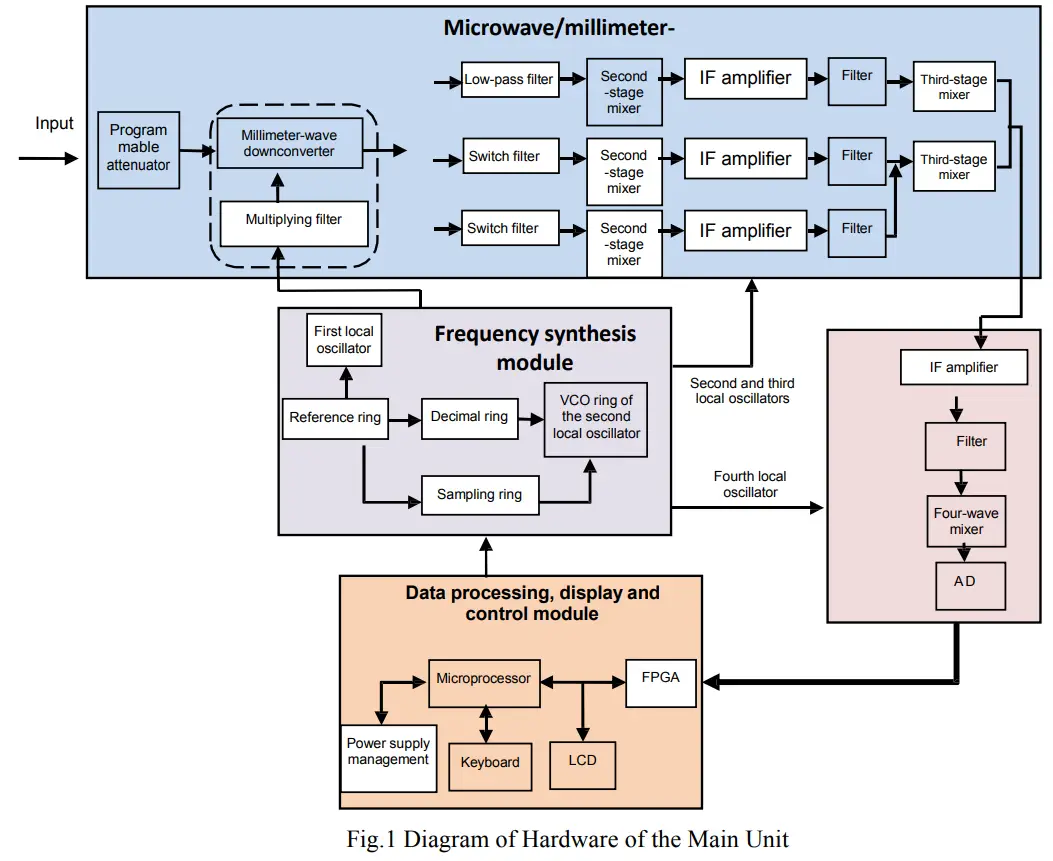
2.1 Microwave/Millimeter-Wave Frequency Conversion Module
It is mainly used for receiving and down-conversion of the input signals of the microwave and millimeter-wave frequency band. The input signals will enter the frequency conversion module through the blocking module and 50 dB programmable step attenuator. The RF signals of 9kHz – 20 GHz and broadband local oscillator signals of 6 GHz – 12 GHz (or its second harmonic) are mixed to produce three second IF signals, namely 6,540.25 MHz of the first band (RF frequency is 9 kHz – 5.35 GHz), 1,740.25 MHz of the second band (RF frequency is 5.35 GHz – 13 GHz) and 3,340.25 MHz of third band (RF frequency is 13 GHz – 20 GHz), and then output 140.25MHz IF signal to the IF channel plate through down-conversion of the third-stage mixer. The signals above 20 GHz frequency band are mixed with the first LO signal after the preamplifier and subsection switching filter to produce first IF signal (5 GHz – 16.5 GHz).The first IF signal and RF signals of 9kHz – 20 GHz are switched into the second-stage mixer after switching by a single-pole double-throw switch, and the frequency conversion scheme is the same as the 5 GHz – 16.5 GHz. The microwave/millimeter-wave frequency conversion module directly affects the frequency conversion loss, noise factor, image frequency and off-band signal suppression and gain compression of the main unit, which consists of the broadband microwave/millimeter-wave switch, low-noise broadband preamplifier, high performance broadband microwave/millimeter-wave mixer, microwave/ millimeter-wave switch filter module, low power consumption LO amplifier and multiplying circuit and microwave switch filter module.
2.2 Frequency Synthesis Module
The frequency synthesis module is mainly used to provide the required LO signals to the three mixers in the microwave/millimeter-wave frequency conversion module and the fourth mixer in the IF signal processing module. It consists of seven phase-lock loops of 5.3 GHz – 5.55 GHz first LO, 6 GHz – 12 GHz second LO, 3,200 MHz third LO and 109 MHz fourth LO, which will directly determine the phase noise, sweep speed, sideband stray, etc. of the main unit.
2.3 IF Signal Processing Module
It is mainly used to carry out amplification and IF gain modulation of 140.25 MHz third IF signal output by the microwave/millimeter-wave frequency conversion module, and then make it enter the acoustic surface wave filter to suppress the out-of-band frequency, and obtain the fourth IF signal by mixing the third IF signal after gain adjustment on the third IF channel with the fourth local oscillator and make it as the AD converter input sampling signal. After AD sampling, it will output the LVDS level to the data processing, display and control module for IF filtering, video detection, digital down-conversion and video filtering, etc., and finally convert it to the testing curve and display it on the LCD.
2.4 Data Processing, Display and Control Module
It includes the switch power conversion, digital signal processing, display and touch screen driver, all kinds of user input and output interfaces required by the main unit and logic control functions of each unit circuit on the main unit. The data processing, display and control module is mainly used to control the circuit of each module to complete the measurement of the spectrum analyzer and the processing and display of the measurement data. It also includes auxiliary functions including the processing of keyboard and touch screen input information, peripheral control, parameter transformation, data and status storage and recall, measurement result output and cursor, as well as statistical analysis and functional support of LAN and USB interfaces.
Chapter 3 Analysis on Common Faults
3.1 Lighting failure of power indicator lamp
Fault cause: The keyboard has fault or the CPU board has communication fault.
Instrument to be repaired: Digital display megawatt multimeter FLUKE 1508.
Repair method:
- Check whether the DC voltage output by the adapter is 14 V – 16 V;
- If the adapter is normal, firstly replace the front cover assembly;
- If the fault still exists after the front cover assembly is replaced, replace the CPU board.
3.2 No response of key
Fault cause: The keyboard has fault and the CPU board has communication fault.
Repair method:
- Firstly check to see if each key of the main unit is stuck;
- Check if the cable connection between the front cover assembly and the CPU board is normal;
- If the cable is normally connected, replace the front cover assembly.
3.3 No zero frequency signal
Fault cause: The communication cable has connection fault or the microwave/millimeter-wave frequency conversion module and frequency synthesis board have fault.
Repair method:
- Check if the semi-rigid cable and flexible cable in the main unit are reliably and correctly connected.
- If the cable is normally connected, please replace the frequency synthesis board, and power it on and check it for zero frequency.
- Please replace the microwave/millimeter-wave frequency conversion module if the abnormality still exists.
3.4 Frequency accuracy out of standard
Fault cause: The IF channel plate or frequency synthesis board has output fault.
Instrument to be repaired: Synthetic signal generator S1465H.
Repair method:
- Eliminate the cable connection reliability problem of the main unit.
- Check if the frequency accuracy significantly changes in case of the internal reference input and the external reference input respectively. If the frequency accuracy significantly changes, it shall be determined that 100 MHz reference ring has fault, and the IF channel plate shall be replaced.
- Please replace the frequency synthesis board if the fault still exists.
3.5 No signal detected when the pan smaller than 5MHz, but normal when the span is larger than 10MHz
Fault cause: The frequency synthesis board has output fault.
Instrument to be repaired: Synthetic signal generator S1465H.
Repair method:
- Eliminate the cable connection problem.
- Replace the frequency synthesis board.
3.6 Large deviation between the signal amplitude of a certain wave band and the actual condition
Fault cause: The microwave/millimeter-wave frequency conversion module has output fault.
Instrument to be repaired: Synthetic signal generator S1465H.
Repair method:
- Eliminate the cable connection fault.
- Replace the microwave/millimeter-wave frequency conversion module.
3.7 SWR deviation at input port
Fault cause: The RF front end connection has fault or the connection cable has fault.
Repair method:
- Check if the connection cables between the RF input connector, blocking module and programmable step attenuator are reliable or loose.
- Please replace the blocking module and the connecting semi-rigid cable if the abnormality still exists.
3.8 Phase noise deviation
Fault cause: The IF channel plate or frequency synthesis board has fault.
Instrument to be repaired: Synthetic signal generator S1465H.
Repair method:
- Replace the IF plate, and verify whether 100 MHz reference ring has any problem or not.
- If the fault is irrelated to the IF plate, it shall be deemed that the frequency synthesis board has local
3.9 Abnormal attenuation control
Fault cause: The attenuator has communication fault.
Instrument to be repaired: Synthetic signal generator S1465H.
Repair method:
- Check if the communication cable of the attenuator is properly fixed and the metal clip is normally installed .
- Replace the rear cover assembly, and check whether the attenuation control is normal.
- Replace the microwave/millimeter-wave frequency conversion module if the fault still exists.
3.10 No display for battery under charging and current charging capacity
Fault cause: The CPU board has fault.
Repair method:
- Maybe the battery is excessive discharged, please charge the battery for half an hour, and see if the icon is correct.
- If the display is still incorrect after charged for half an hour, remove the battery and see if the power supply icon is the icon of the external power supply. If not, please replace the CPU board.
Chapter 4 Repair of Parts
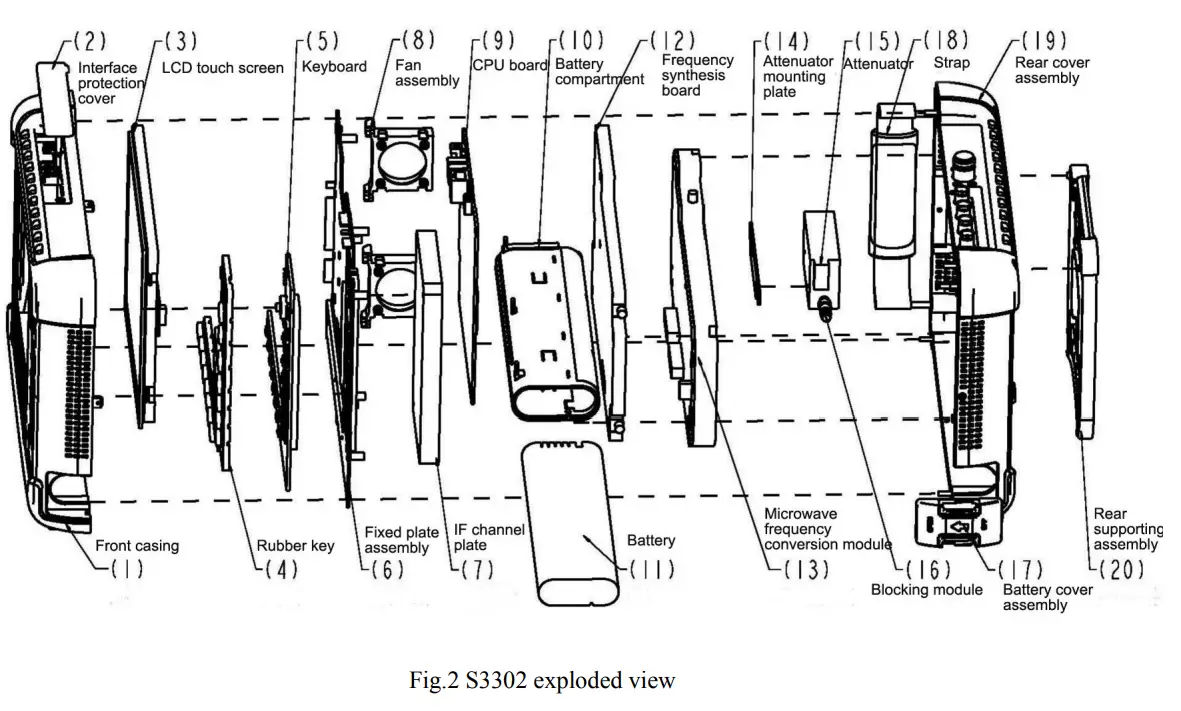
When the S3302 series spectrum analyzer has any fault and the casing shall be opened to check the fault cause or the spare parts and complete parts shall be replaced, please refer to the schematic diagram of S3302 structure decomposition, and remove and install it according to the instruction.
4.1 Removal Process
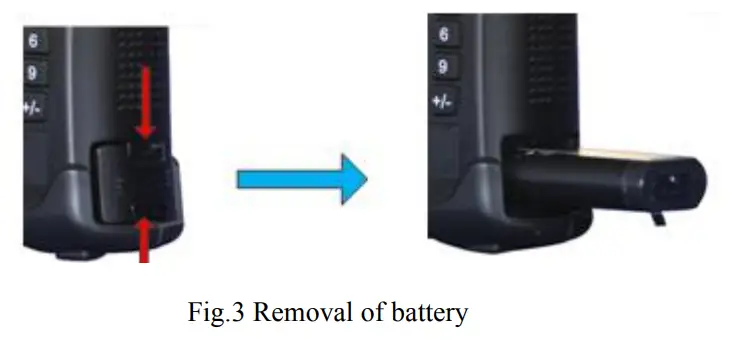
- Remove the battery cover assembly (17), and then remove the battery (11).

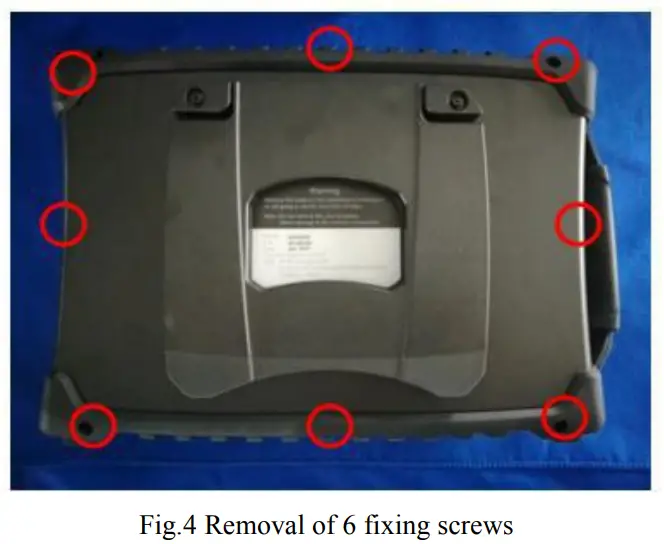
- Gently place the S3302 series spectrum analyzer on the table with back upwards, and remove eight fixing screws (four on the back and four on the side) of the casing with a Phillips screwdriver.

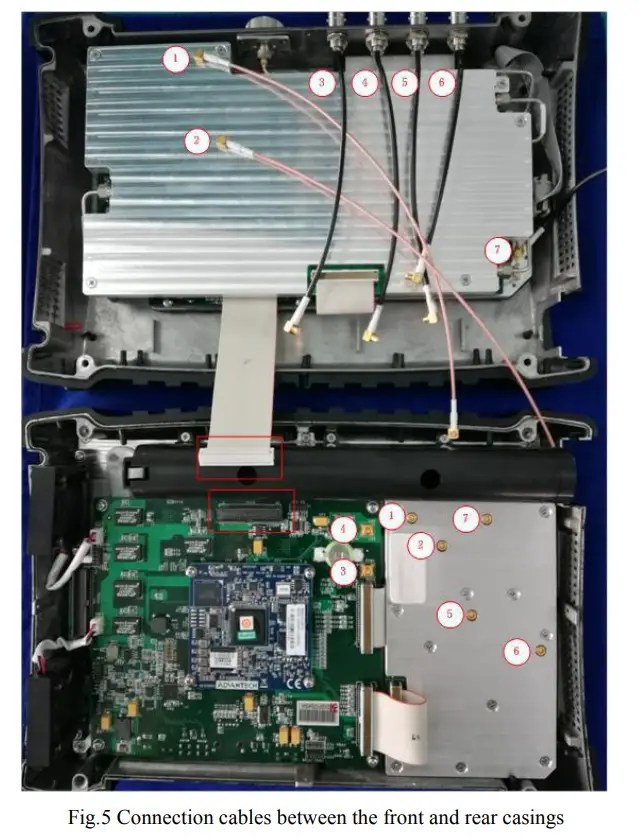
- Separate S3302 front casing from its rear casing (Attention: In this case, two parts of the casing are connected by multiple cables, do not separate the casing forcibly). Firstly, remove one end of the interconnecting cable between the front and rear casings, and then place them on the table. In case of reassembly, pay attention to the relationship of the connection cables, as shown in the following figure.

- Remove the rear casing assembly:
Firstly, remove and replace the frequency synthesis board (12):
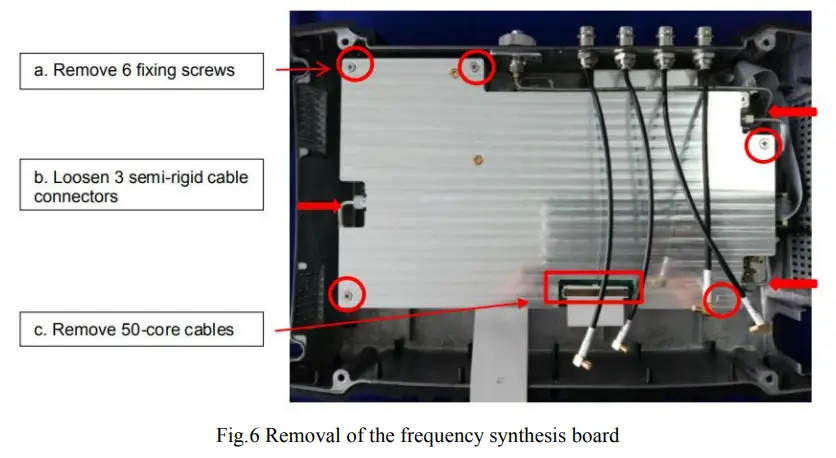
a) Firstly, remove 6 fixing screws of the frequency synthesis board (12) in the rear cover assembly (19).
b) Loosen 3 semi-rigid cables between the frequency synthesis board (12) and the microwave frequency conversion module (13).
c) Remove the interconnecting flat cable between the microwave frequency conversion module (13) and the frequency synthesis board (12).
d) The installation process is reverse to the removal process. The microwave frequency conversion module (13) after removal of the frequency synthesis board (12) is as shown in the following figure. The removal and installation processes are as follows:
a) Remove 4 fixing screws between the microwave frequency conversion module (13) and the rear cover assembly (19). Please note that two screws on the right side have two washers.
b) Remove the connection flat cable between the attenuator (15) and the microwave frequency conversion module (13).
c) Remove the connection semi-rigid cable between the attenuator (15) and the microwave frequency conversion module (13).
d) After the module is removed, the rest is the rear cover assembly (19).
e) The installation process is reverse to the removal process.
- Remove the front casing assembly:
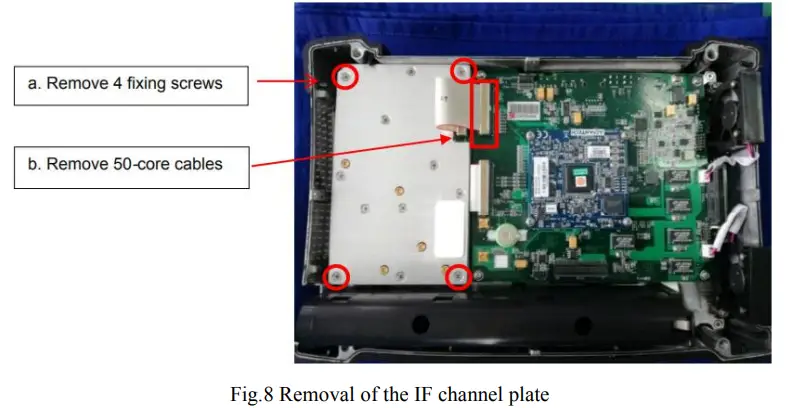
Firstly, remove and replace the IF channel plate (7):
a) Remove 4 fixing screws of the IF channel plate (7).
b) Remove the interconnecting 50-core flat cables between the CPU board (9) and the IF channel plate (7).
c) The installation process is reverse to the removal process. After that, remove and replace the CPU board (9):
a) Remove the interconnecting 50-core cables between the CPU board (9) and the keyboard (5).
b) Remove the connection cables between the CPU board (9) and 2 fan components (8).
c) Remove 4 fixing screws of the CPU board (9), and then remove the CPU board (9).
d) Remove the connection cable of the battery compartment (10) at the back.
e) The installation process is reverse to the removal process.
 The microwave frequency conversion module (13) after removal of the frequency synthesis board (12) is as shown in the following figure. The removal and installation processes are as follows:
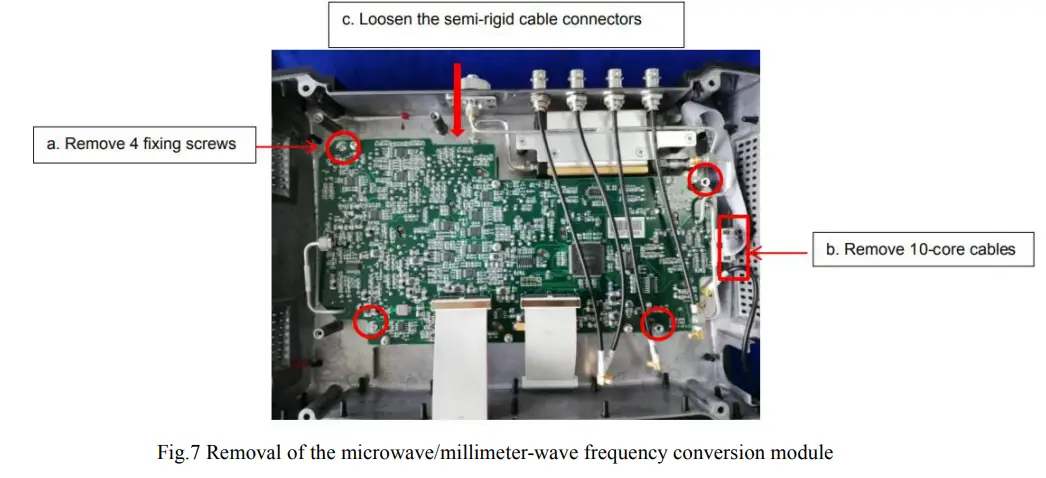
 After that, remove and replace the CPU board (9):
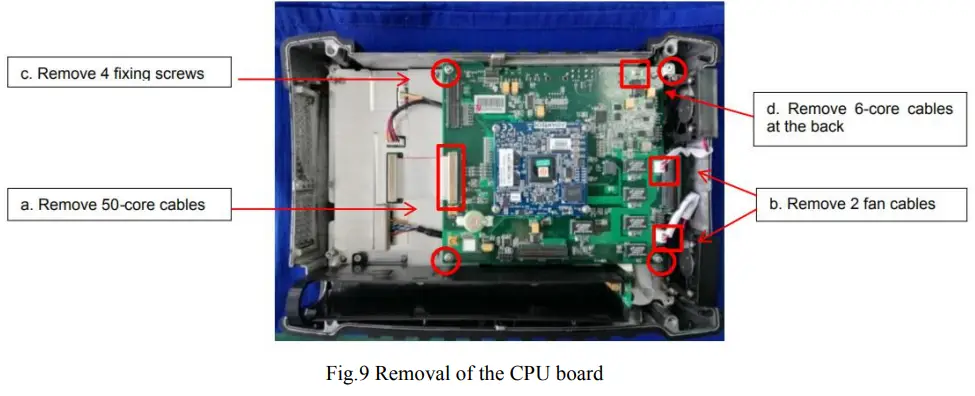
Chapter 5 Calibration of the Main Unit
5.1 Temperature Compensation
- Software environment
Name of the software Version Description Windows system Win7/XP The compensation software operating environment needs GPIB driver and Visa library TempComp.exe 1.1.0 Temperature compensation software NI-GPIB driver.rar GPIB-USB-HS NI GPIB driver installation package visa462full.exe 4.6.2 Visa library installation package - Hardware environment
Instrument name Main technical indicators Synthesized signal generator Frequency range: 250 kHz – 50 GHz Power output: -100 dBm to +15 dBm Frequency accuracy: ±0.02%
The power level can be calibrated and stored.
It has internal and external AM modes and low frequency output function.Power meter Frequency GPIB card 67GHz Power range: -60 dBm to +20 dBm Power sensor Frequency range: 50MHz – 67GHz Power range: -60 dBm to +20 dBm Adapter 2.4 mm (f) – 2.4 mm (f) Adapter 2.4mm(f) – 3.5mm(f) Adapter 2.4 mm (m) – 3.5 mm (f) Adapter 2.4 mm (f) – N (m) Adapter 2.4 mm (m) – N (m) Cable BNC (m) – BNC (m), 2 m Low loss cable 2.4 mm cable (m-m), 1.5 m USB-GPIB control card USB-GPIB control card GPIB cable 1.5 m - Test steps
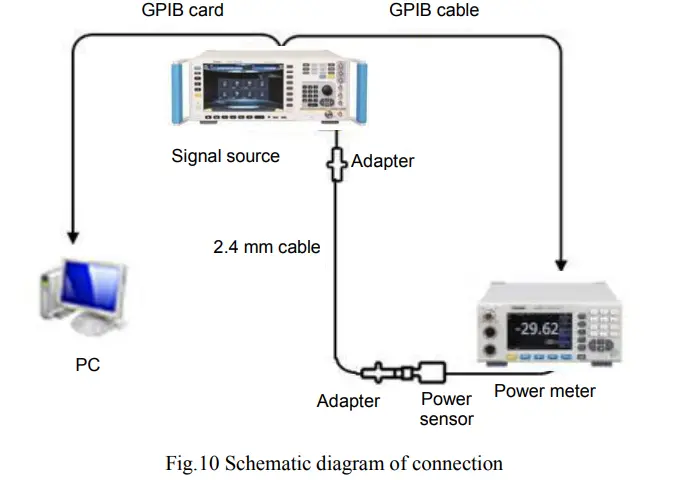
(1) Firstly connect the signal generator with the power meter through the GPIB cable, connect the GPIB cable with the PC through the GPIB card, and connect S3302 to be tested with the PC through the direct-connected network cable. It is as shown in the figure: (2) Open the temperature compensation software TempComp.exe, and the software interface is as follows:
 Click the Set Address button, and the communication address setting dialog will pop up. As shown in the following figure, the GPIB address of the signal source to be connected, the GPIB Address of the power meter and the IP Address of the spectrum analyzer can be set. The address of the signal source and power meter can be inquired through 【System】 menu. If the GPIB number of the signal source is 19, no modification is required; similarly, if the GPIB number of the power meter is 13, no modification is required. The IP address of the spectrometer can be inquired through 【System】->[Network Config].
 Attention: In case of the initial compensation, the following steps 3) and 4) shall be carried out. If steps 3) and 4) have been carried out and “PowerMeter.powdoc” and “cal.txt” files have been generated under the current directory, start from step 2 directly in case of re-compensation of other spectrometers. In addition, when replacing another signal source or another cable for compensation, steps 3) and 4) shall be carried out again.
(3) Click Measure Power Meter to measure the actual power value of the signal generator after passing the cables. The interface is as shown in the following figure. When the test is completed, it will prompt to generate the file “PowerMeter.powdoc”. (4) This step is mainly intended to measure the loss value of the cable. After the power meter is calibrated and zeroed, connect 2.4 mm (m-m) low loss RF cable with the S1465H signal generator. When the power sensor is connected with 2.4 mm (m-m) low loss RF cable, 2.4 mm (f-f) adapter shall be used (when testing the S3302A/B, type 2.4 mm (f)-N (m) adapter shall be used). After that, select the “ Calibration Signal Source ” of the compensation software. When the measurement is completed, the status bar will prompt “ Calibration Signal Source Finish”, and “Cal.txt” will be generated. The interface is as follows:
 (5) Set the path, click “Set Path”, and select the path of the DAC and temperature compensation file, and then the follow-up measurement DAC file, S3302 test file as well as the compensation file will be placed into a folder with the name of the spectrometer serial number.
(6) Check S3302 series spectrum analyzer to ensure that there are no IF DAC files and compensation files. If a DAC or compensation file exists, it shall be deleted firstly. The specific operation is as follows: Connect the PC with the S3302 spectrum analyzer with a point-to-point network cable, open the S3302 host folder:
“ftp://172.141.xx.xx/” in PC browser, delete tc.tcdoc and IFGainAtten.dc in the MMCMemory folder, and then restart the spectrum analyzer.
Attention: The IP address of the S3302 spectrometer and PC shall be located on the same network segment.
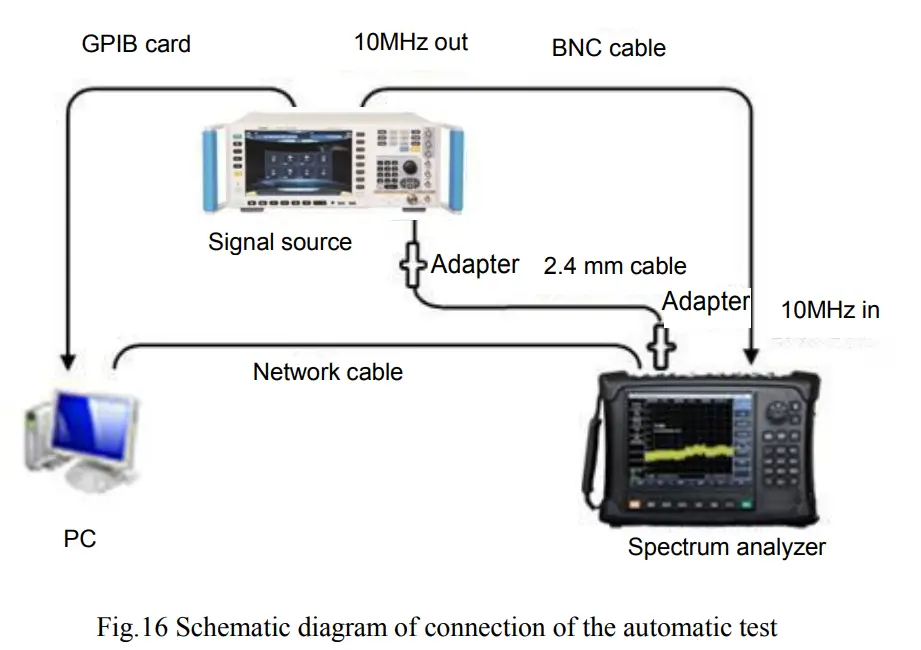
If they are different, the IP of the computer or spectrometer shall be set to make it within the same network segment (for example, if the IP of the spectrometer is 172.141.11.202, the IP of the computer shall be set to 172.141.11.xx). Connect the computer with the spectrum analyzer with a point-to-point network cable; connect the BNC cable with 10 MHz reference input of the spectrometer and 10 MHz reference output of the signal source, and then connect the cable connected with the power meter sensor in steps 3) and 4) with the RF input port of the spectrometer, as shown in the above figure. Click Calibration Spectrum, and when the calibration is completed, it will prompt that the “IFGainAtten.dc” file will be generated. This file is in the folder with the name of the serial number created in step 5).
(7) Keep the connection mode in step 7 unchanged and click the Measure Spectrum, and the compensation program will carry out S3302 preamplifier OFF and preamplifier OFF data test, the screen will prompt the current measurement tasks, and it will prompt to generate the “tc.tcdoc” file after the measurement is completed,
as shown in the following figure. When this file and “IFGainAtten.dc” are in the same folder, the temperature compensation is completed.
 (2) Open the temperature compensation software TempComp.exe, and the software interface is as follows:
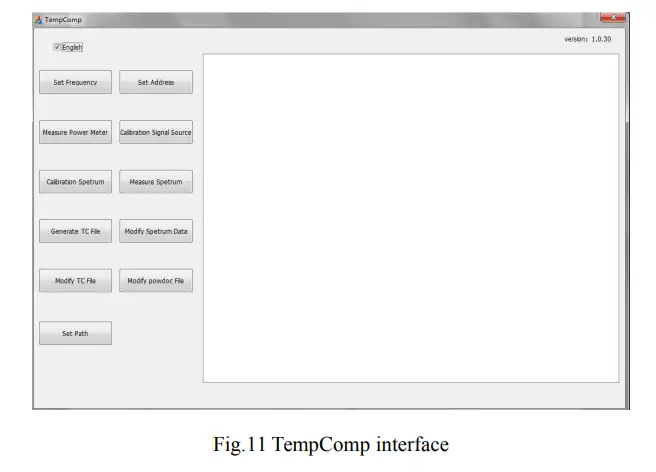 Click the Set Address button, and the communication address setting dialog will pop up. As shown in the following figure, the GPIB address of the signal source to be connected, the GPIB Address of the power meter and the IP Address of the spectrum analyzer can be set. The address of the signal source and power meter can be inquired through 【System】 menu. If the GPIB number of the signal source is 19, no modification is required; similarly, if the GPIB number of the power meter is 13, no modification is required. The IP address of the spectrometer can be inquired through 【System】->[Network Config].
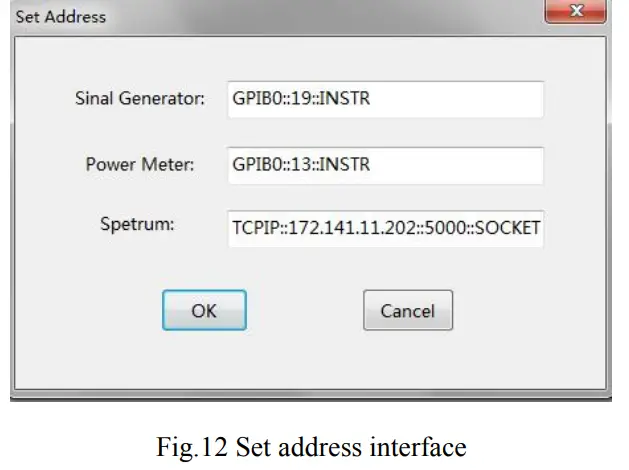 Attention: In case of the initial compensation, the following steps 3) and 4) shall be carried out. If steps 3) and 4) have been carried out and “PowerMeter.powdoc” and “cal.txt” files have been generated under the current directory, start from step 2 directly in case of re-compensation of other spectrometers. In addition, when replacing another signal source or another cable for compensation, steps 3) and 4) shall be carried out again.
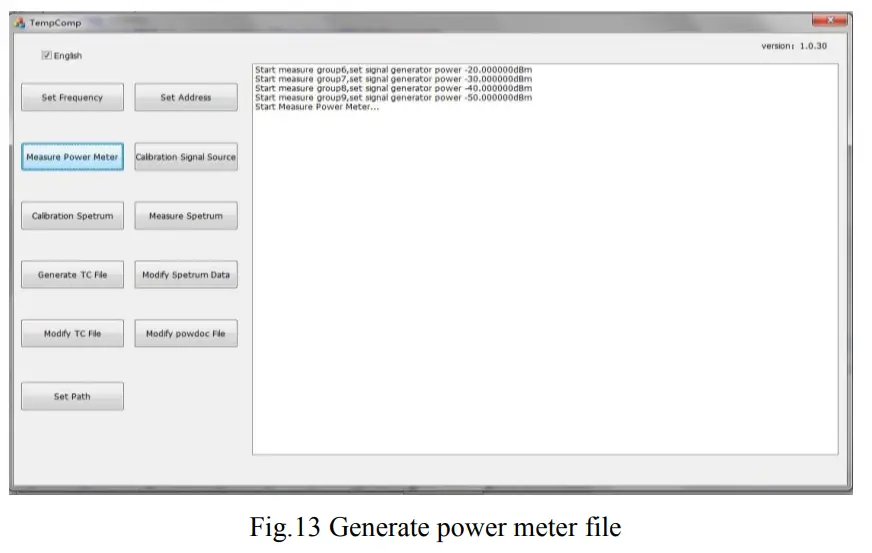 (4) This step is mainly intended to measure the loss value of the cable. After the power meter is calibrated and zeroed, connect 2.4 mm (m-m) low loss RF cable with the S1465H signal generator. When the power sensor is connected with 2.4 mm (m-m) low loss RF cable, 2.4 mm (f-f) adapter shall be used (when testing the S3302A/B, type 2.4 mm (f)-N (m) adapter shall be used). After that, select the “ Calibration Signal Source ” of the compensation software. When the measurement is completed, the status bar will prompt “ Calibration Signal Source Finish”, and “Cal.txt” will be generated. The interface is as follows:
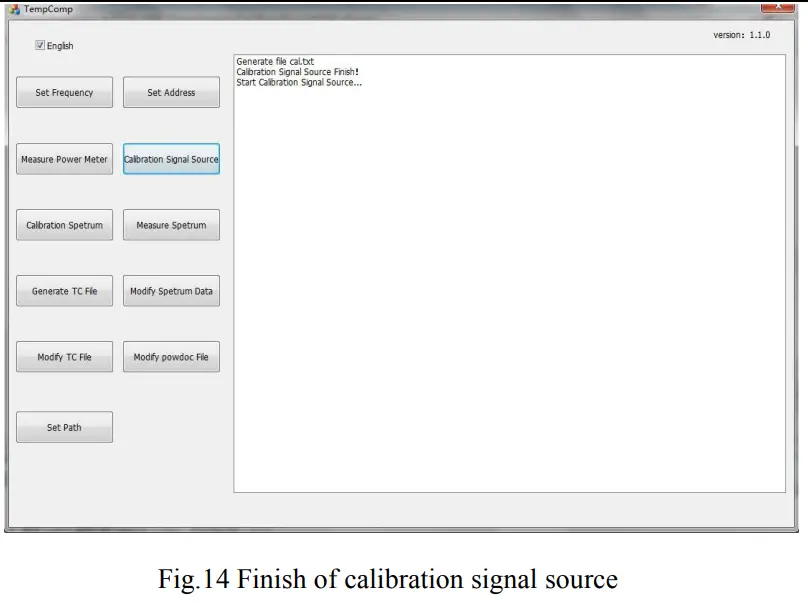 (5) Set the path, click “Set Path”, and select the path of the DAC and temperature compensation file, and then the follow-up measurement DAC file, S3302 test file as well as the compensation file will be placed into a folder with the name of the spectrometer serial number.
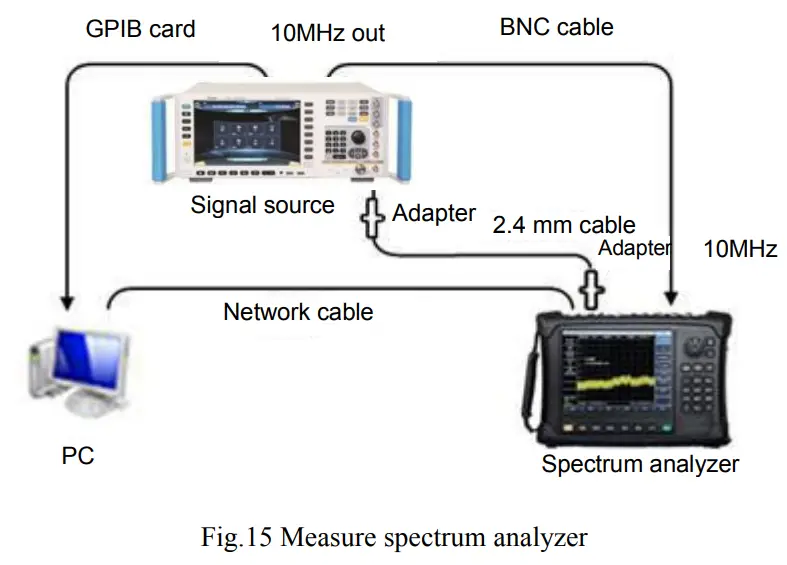 Connect the computer with the spectrum analyzer with a point-to-point network cable; connect the BNC cable with 10 MHz reference input of the spectrometer and 10 MHz reference output of the signal source, and then connect the cable connected with the power meter sensor in steps 3) and 4) with the RF input port of the spectrometer, as shown in the above figure. Click Calibration Spectrum, and when the calibration is completed, it will prompt that the “IFGainAtten.dc” file will be generated. This file is in the folder with the name of the serial number created in step 5).
5.2 Automatic Test of Indicators
- Software environment
Name of the software Version Description Windows system Win7/XP The compensation software operating environment needs GPIB driver and Visa library S3302 AutoTest.exe 1.0.5 Software for automatic test of indicator NI-GPIB driver.rar GPIB-USB-HS NI GPIB driver installation package visa462full.exe 4.6.2 Visa library installation package - Hardware environment
Instrument name Main technical indicators Synthesized signal generator Frequency range: 250 kHz – 50 GHz Power output: -100 dBm to +15 dBm Frequency accuracy: ±0.02% The power level can be calibrated and stored.
It has internal and external AM modes and low frequency output function.Power meter Frequency range: 50MHz – 67GHz
Power range: -60 dBm to +20 dBmPower sensor Frequency range: 50MHz – 67GHz
Power range: -60 dBm to +20 dBmLow-pass filter Cutoff frequency: 1.0 GHz, insertion loss<0.9 dB, off-band suppression>65 dB Low-pass filter Cutoff frequency: 6.7GHz, insertion loss<1 dB, off-band suppression>40 dB Low-pass filter Cutoff frequency: 18GHz, insertion loss<2 dB, off-band suppression>40 dB 50Ω adapter Impedance: 50Ω, interface type: 2.4 mm female Adapter 2.4 mm (f) – 2.4 mm (f) Adapter 2.4mm(f)-3.5mm(f) Adapter 2.4 mm (m) – 3.5 mm (f) Adapter 2.4 mm (f) – N (m) Adapter 2.4 mm (m) – N (m) Cable BNC (m) – BNC (m), 2 m Low loss cable 2.4 mm cable (m-m), 1.5 m USB-GPIB control card USB-GPIB control card GPIB cable 1.5 m - Test steps
(1) Connect the computer with the spectrum analyzer with a point-to-point network cable; connect the BNC cable with 10 M reference input of the spectrometer and 10 M reference output of the signal source, and then connect the 2.4 mm (m-m) low loss RF cable with the S1465H signal generator, and finally connect the spectrometer RF input with the 2.4mm (m-m) low loss RF cable with 2.4 mm (f-f) adapter. (When testing the S3302A/B, use the 2.4 mm (m)-N (m) adapter; when testing the S3302C/D, use the 2.4 mm (f-f) adapter). Connect the computer with the signal generator with the GPIB card and GPIB cable, as shown in the following figure. (2) Open S3302 AutoTest.exe, and the interface is as follows:
 (3) Fill in the communication parameters in the communication parameter setting column, including the IP address of the spectrometer, signal source address (S1465H), and power meter address. The address of the signal source and power meter can be inquired through System menu. If the GPIB number of the signal source is 19, no
modification is required; similarly, if the GPIB number of the power meter is 13, no modification is required. The IP address of the spectrometer can be inquired through 【System】- [Network Configuration].
Attention: The IP address of the S3302 spectrometer and PC shall be located on the same network segment.
If they are different, the IP of the computer or spectrometer shall be set to make it within the same network segment (for example, if the IP of the spectrometer is 172.141.11.202, the IP of the computer shall be set to 172.141.11.xx).
Click the indexes to be tested, and click Start Test. Attention:
① In case of measurement and display of the average noise level and remaining response, a 50Ω load shall be connected at the RF port. The indicators including test frequency range, third-order intercept point, 1 dB gain compression and standing-wave ratio can only be manually tested.
② In case of initial measurement of the reference level, scale fidelity and total level uncertainty, the power meter shall be connected for calibration. No recalibration is needed when another spectrometer is tested.
(4) After the test of all indexes is completed, click Save Data to save the test results in the form of word files.
 (2) Open S3302 AutoTest.exe, and the interface is as follows:
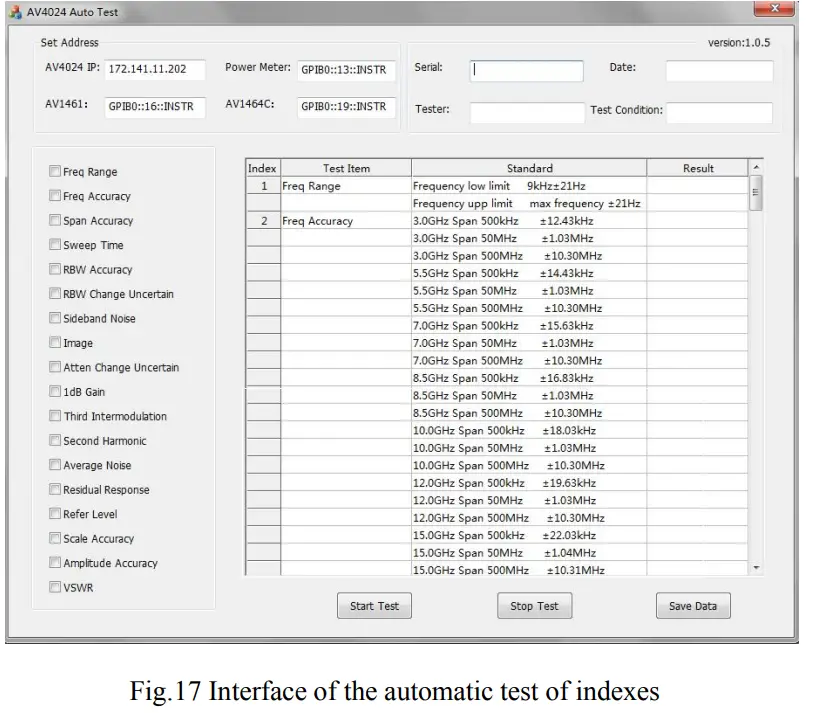 (3) Fill in the communication parameters in the communication parameter setting column, including the IP address of the spectrometer, signal source address (S1465H), and power meter address. The address of the signal source and power meter can be inquired through System menu. If the GPIB number of the signal source is 19, no
![]()
Tel: 886.909 602 109 Email: [email protected]
www.salukitec.com
Contacts
Service Tel: 886.909 602 109
Website: www.salukitec.com
Email: [email protected]
Address: No. 367 Fuxing N Road, Taipei 105, Taiwan (R.O.C.)


