KIKUSUI Vf File Analyzer Ver. 3.9x Application Software User Guide
Introduction
This operation guide explains how to:
- Analyzes the data of a test results file that is acquired during a voltage fluctuation test using HarmoCapture or acquired with KHA1000, and
- Print reports of test result files.
Product versions that this guide covers
This operation guide applies to Vf File Analyzer with version 3.9x.
You can check the version from the help menu Vf File Analyzer.
Who should read this operation guide?
The intended audience of this operation guide is anyone using the KHA1000 to control a harmonic current and voltage fluctuation test system or anyone teaching operators how to use such a system.
Explanations are given under the presumption that the reader has electrical knowledge related to harmonic current and voltage fluctuation tests.
Notations used in this guide
- The KHA1000 Harmonic/Flicker Analyzer may be called the KHA1000.
- “PC” in this guide is generic term for personal computers and workstations.
- “PDF Viewer” in this guide is a general term for software that can view PDF.
- The following symbols are used with the explanations in this guide.
 CAUTION
This symbol indicates a potentially hazardous situation. Ignoring the symbol may result in damage to the product or other property. Indicates information that you should know.
Trademark acknowledgements
Microsoft and Windows are either registered trademarks or trademarks of Microsoft Corporation in the United States and/or other countries.
Other company names and product names that appear in this guide are trademarks or registered trademarks of their respective companies.
Copyrights
The contents of this operation guide may not be reproduced, in whole or in part, without the prior consent of the copyright holder.
The specifications of this product and the contents of this operation guide are subject to change without prior notice.
© 2006 Kikusui Electronics Corporation
What is Vf File Analyzer?
Vf File Analyzer is application software that analyzes the data of a test results file (xxx.vr) that is acquired during a voltage fluctuation test using HarmoCapture or acquired with KHA1000. Vf File Analyzer operates without being connected to the KHA1000.
Vf File Analyzer can be used to:
- Load the voltage fluctuation test results file acquired by the KHA1000 or HarmoCapture.
- Display test results lists (pass/fail judgment and segment information list.)
- Display graphs (the maximum dc, the maximum dmax, and waveform with the longest time where Tmax*1 (or d(t)>3.3%.)
- Save test results files as text.
- Print reports (comments, test conditions, results lists, and various waveform graphs.)
![]() *1 Support for the IEC 61000-3-3 Ed3.1 standard
*1 Support for the IEC 61000-3-3 Ed3.1 standard
In the IEC 61000-3-3 Ed3.1 standard, Tmax is defined as the accumulated time value in which d(t) exceeds 3.3 % between steady-state voltage changes. A test result file obtained by selecting the IEC 61000-4-15 Ed2.0 standard is compatible with the IEC 61000-3-3 Ed3.1 standard. A test result file obtained by selecting the Ed1.1 standard complies with the IEC 61000-3-3 Ed2.0 standard.
Opening a Test Results File
There are two types of test results file.
- Test results file acquired by HarmoCapture
- Test results file acquired by the KHA1000
You can open two test result files at the same time in Vf File Analyzer3. The files are displayed as test data A and test data B.
You can open test result files that you have already opened from the file list.
Opening a Test Results File Acquired by HarmoCapture
- In the toolbar, click the
 next to Open and select File A or File B.
The FileA(B) Open dialog box appears.
If you click Open, priority is given to file A, and the FileA Open dialog box appears. - Select the file that you want to open.
The test results file name extension for voltage fluctuation tests is .vr
Opening a Test Results File Acquired by the KHA1000
Follow the procedure below to load a test condition file that was acquired on the KHA1000 to the PC and open it with Vf File Analyzer.
- Remove the CompactFlash card that contains the test conditions from the KHA1000.
- Connect the CompactFlash card to the PC.
- Load the test condition file from the CompactFlash card to the PC.
- In the toolbar, click the next to Open and select File A or File B.
The FileA(B) Open dialog box appears.
If you click Open, priority is given to file A, and the FileA Open dialog box appears. - Select the file that you want to open.
The test results file name extension for voltage fluctuation tests is .HR3.
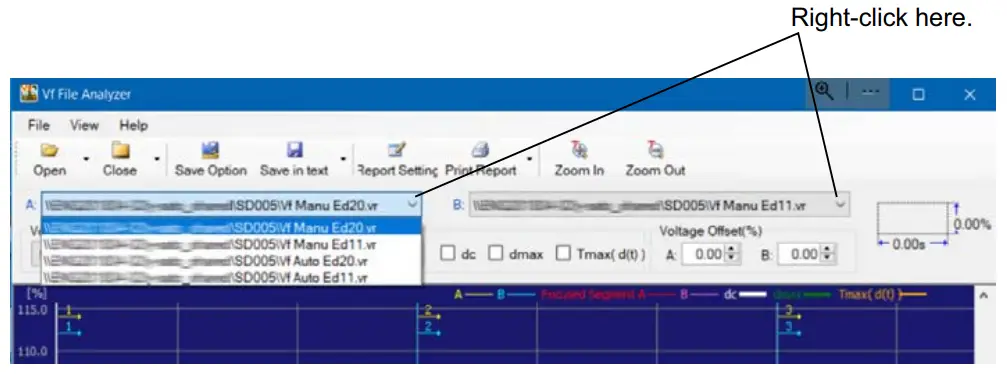
Opening a Previously Opened Test Result File
- Right-click the box next to A: or B:.
A list of previously opened files appears.
Up to nine previous entries are stored in the boxes’ lists. The oldest entry is removed first
- Select the file that you want to open from the list.
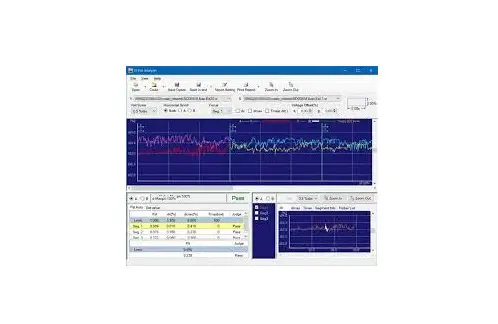
Window Configuration
The window is divided into three panes.
You can drag the splitters to resize the panes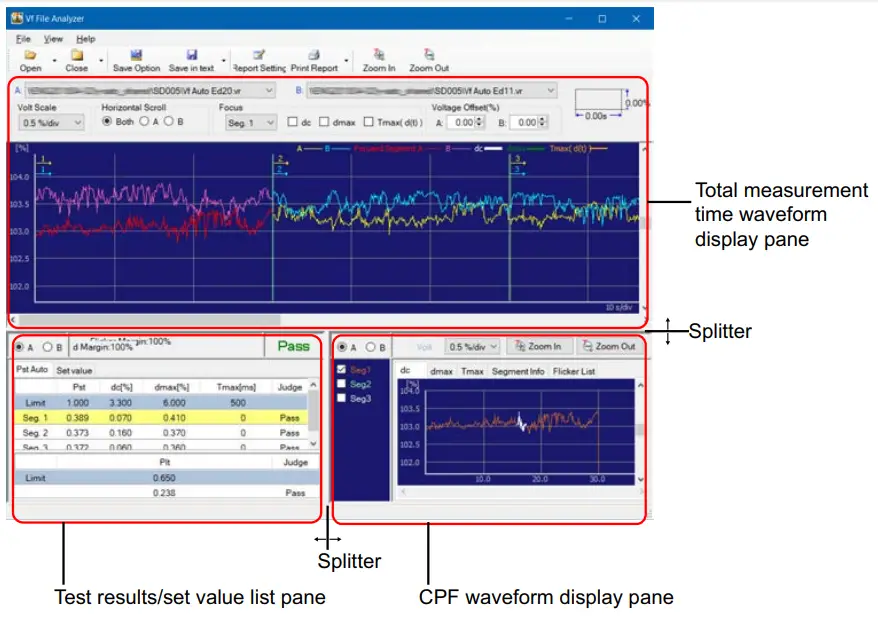
| Item | Description |
| Total Measurement Time Waveform Display Pane p. 7 | Displays the voltage fluctuation waveform of each measurement time. Each measurement time is connected together along the time axis. The vertical axis represents the voltage ratio with respect to the nominal voltage in terms of a percentage. The horizontal axis represents the elapsed time in unit of seconds. Test data A and B are displayed simultaneously |
| Test Results/Set Value List Pane p. 9 | Displays the test results list and test conditions. The judgment result of each segment and the final judgment over all the measurement times are displayed. You can click the tab to switch between the test results list and test conditions data displays. Select test data A or B to be displayed. |
| Segment Waveform Display Pane p. 12 | Displays the voltage fluctuation waveform of each segment simultaneously. You can show or hide each segment using the check box. You can also select dc, dmax, or Tmax*1 to be displayed using tabs. The Segment Info list displays the start time and steady-state count in the segment of the dc, dmax, and Tmax*1 waveforms. Select test data A or B to be displayed. |
When a test result file obtained by selecting the IEC 61000-3-3 and IEC 61000-4-15 Ed2.0 standards are opened, this is displayed as “Tmax.” If a test result file obtained by selecting the IEC 61000-3-3 and IEC 61000-4-15 Ed1.1 standards are opened, this is displayed as “d(t)>3.3%.” If a graph is displayed with both test data files A and B (described earlier) opened, this is displayed as “Tmax(d(t)).”
If a test result file is not open, this is displayed as “Tmax.”
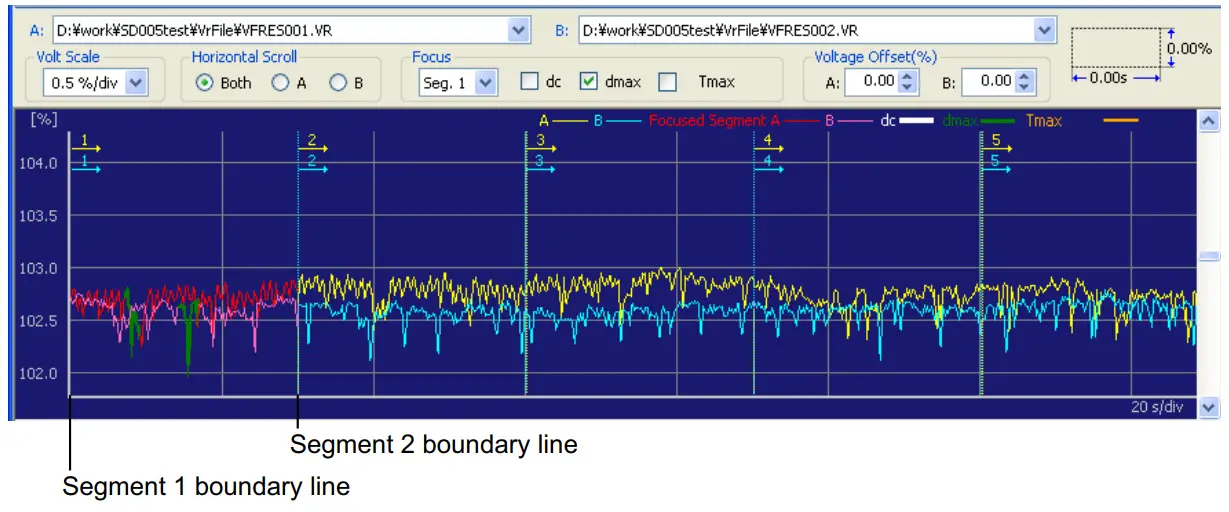
Total Measurement Time Waveform Display Pane
| Item | Description |
| A and B | The full paths of the files that you specified as test data A and B are displayed in these boxes. Lower-level folder names that do not fit into the boxes are indicated with ellipses (“…”). Click to display a history of up to nine previous paths. |
| Volt Scale | Used to select the graph along the voltage fluctuation ratio axis (vertical axis). |
| Horizontal Scro | Used to specify the test data that is scrolled along the time axis. Select Both to scroll both test data A and B. Select A to scroll only test data A. Select B to scroll only test data B. |
| Focus | Vertical lines with arrows and numbers indicate the boundaries between segments. The segments are arranged in order by segment number from the left edge of the graph. Specify the segments that you want to display in the Focus box. If you select dc, dmax, or Tmax*1, the items that you select are highlighted with different colors |
| Voltage offset | Used to offset a waveform vertically for easier viewing if waveforms A and B are overlapped. Enter a positive value to shift the waveform up or a negative value to shift it down. You can adjust a value by using the arrows to its right. |
When a test result file obtained by selecting the IEC 61000-3-3 and IEC 61000 4-15 Ed2.0 standards are opened, this is displayed as “Tmax.” If a test result file obtained by selecting the IEC 61000-3-3 and IEC 61000-4-15 Ed1.1 standards are opened, this is displayed as “d(t)>3.3%.” If a graph is displayed with both test data files A and B (described earlier) opened, this is displayed as “Tmax(d(t)).”
If a test result file is not open, this is displayed as “Tmax.”
Measuring the voltage fluctuation ratio and the time
You can measure the voltage fluctuation ratio (vertical axis) and time (horizontal axis) at any location on the graph. When you drag the mouse and create a rectangle, it’s vertical and horizontal values are displayed in the upper right of the pane.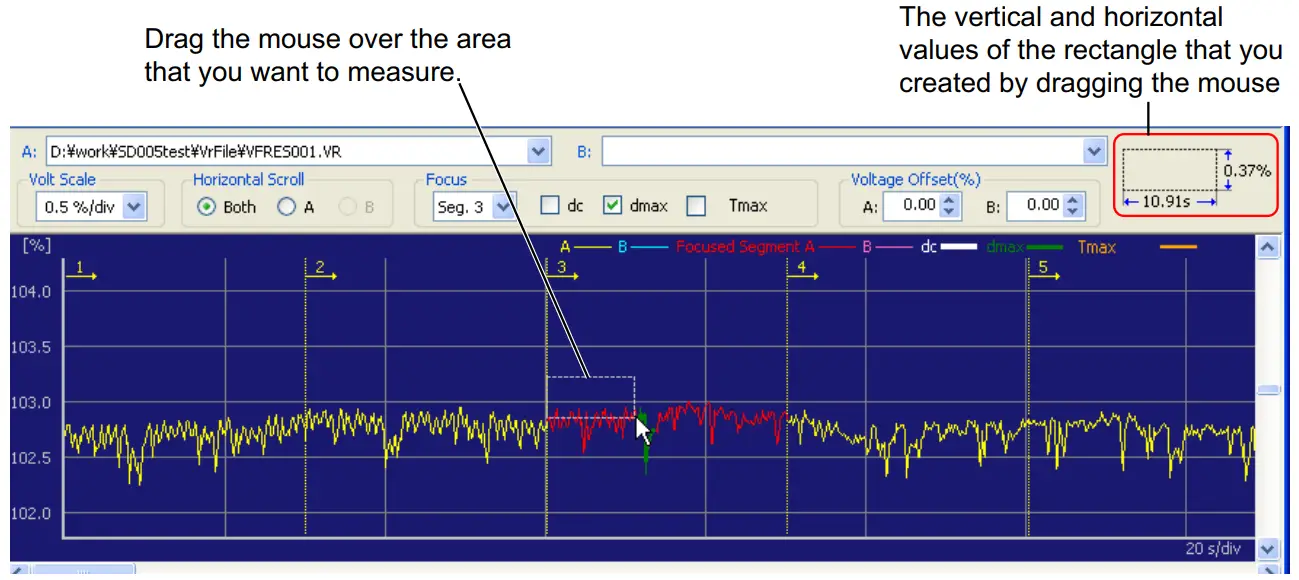
Concurrent menu
Right-click the graph area to display a Concurrent menu. A number of useful features for observing waveforms are arranged in the Concurrent menu. Features that cannot be used because of the current condition of the waveform are dimmed.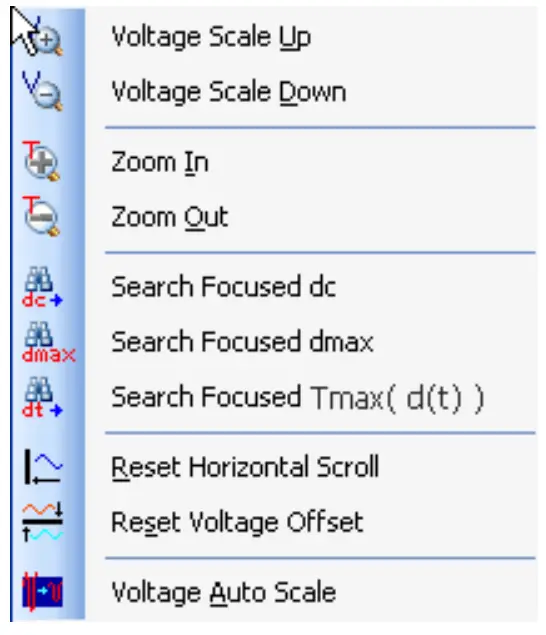
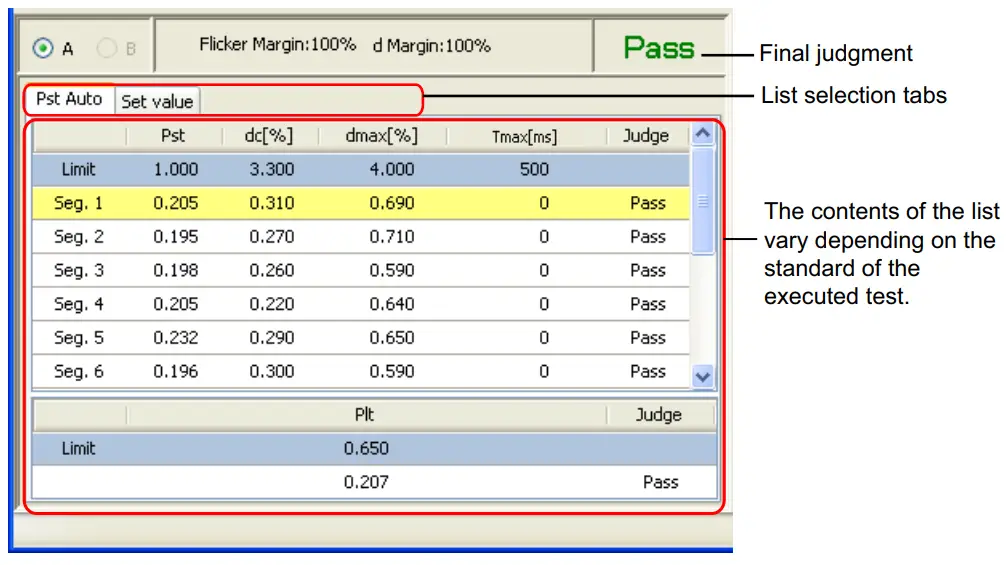
Test Results/Set Value List Pane
| Item | Description |
| A and B | Used to select the test data, A or B, to be displayed in the test results/set value list pane. |
| Flicker Margin | The flicker margin (as a percentage) that has been specified in the HarmoCapture or KHA1000 test conditions. This value does not appear when d measurement is performed manually. |
| d Margin | The d margin (as a percentage) that has been specified in the HarmoCapture or KHA1000 test conditions. |
| Final judgment | Displays the final pass/fail judgement from the judgment of each segment. Pass : Less than equal to the specified margin Warn : Greater than the specified margin but less than the limit value Fail : Greater than the limit value |
| List selection tabs | Select the list that you want to display. The name of the tab on the far left indicates the standard of the executed test. Auto : IEC 61000-3-3(Pst Auto) Manual : IEC 61000-3-3(Manual) |
Items in the test results list for IEC 61000-3-3(Pst Auto)
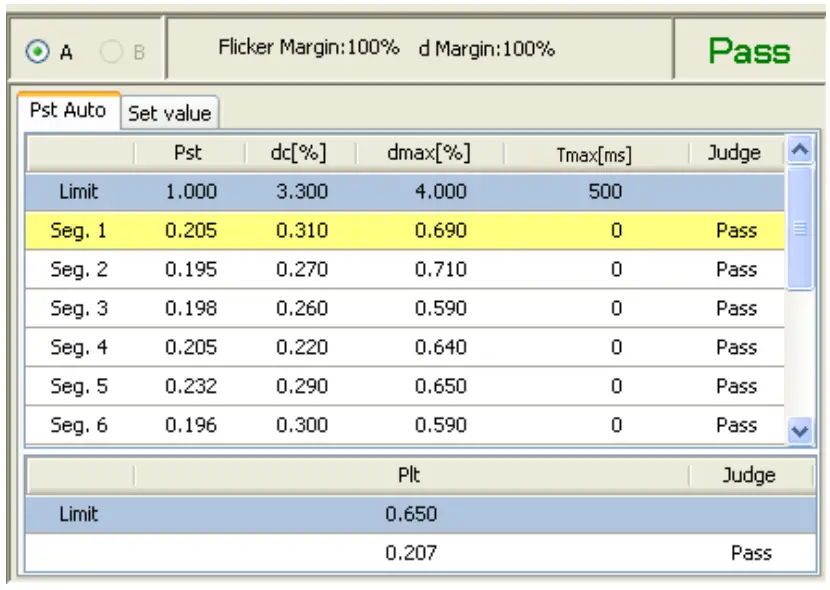
| Item | Description |
| Pst | Short-term flicker value in one segment time. |
| dc [%] | Maximum value of the relative steady-state voltage fluctuation in one segment time |
| dmax [%] | Maximum value of the maximum relative voltage fluctuation in one segment time. |
| Tmax*1 [ms] | Maximum value of the time during which d(t) exceeds 3.3 % in one segment time |
| Judgment (each segment) | Indicates the pass/fail judgment of the voltage fluctuation and flicker in one segment time. Pass : Less than equal to the specified margin Warn : Greater than the specified margin but less than the limit value Fail : Greater than the limit value |
| Limit | Limit value of each item |
| Plt | Long-term flicker value over the total measurement time |
| Judgment (Plt) | Indicates the pass/fail judgment of the long-term flicker value over the total measurement time. Pass : Less than equal to the specified margin Warn : Greater than the specified margin but less than the limit value Fail : Greater than the limit value |
When a test result file obtained by selecting the IEC 61000-3-3 and IEC 61000 4-15 Ed2.0 standards are opened, this is displayed as “Tmax.” If a test result file obtained by selecting the IEC 61000-3-3 and IEC 61000-4-15 Ed1.1 standards are opened, this is displayed as “d(t)>3.3%.” If a graph is displayed with both test data files A and B (described earlier) opened, this is displayed as “Tmax(d(t)).”
If a test result file is not open, this is displayed as “Tmax.”
Items in the test results list for IEC 61000-3-3 (Manual)
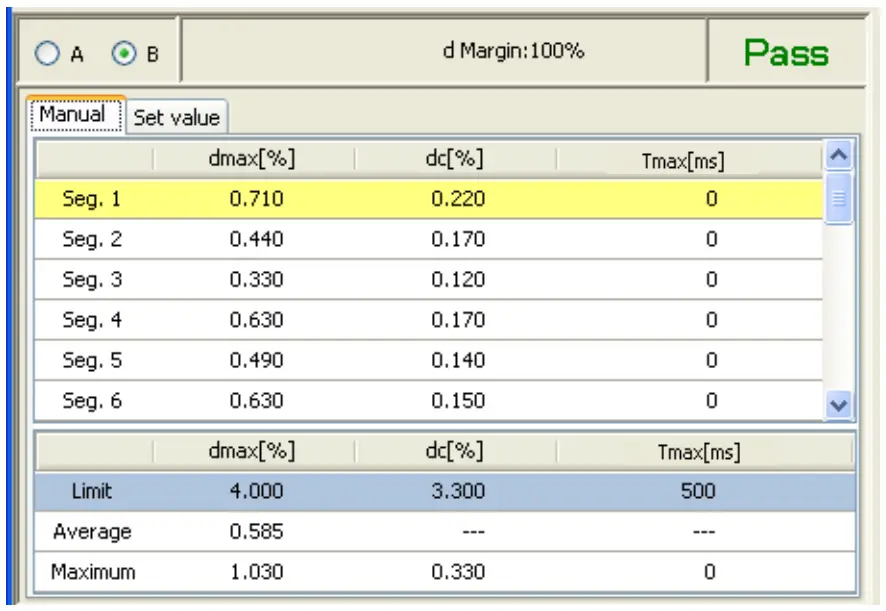
| Item | Description |
| dmax [%] | Maximum value of the maximum relative voltage fluctuation in one segment time. |
| dc [%] | Maximum value of the relative steady-state voltage fluctuation in one segment time. |
| Tmax*1 [ms] | Maximum value of the time during which d(t) exceeds 3.3 % in one segment time. |
| Limit | The dmax, dc, and Tmax*1 (ms) limits |
| Average | The average value of dmax in each segment. |
| Maximum | The maximum dmax, dc, and Tmax*1 (ms) values in each segment. |
When a test result file obtained by selecting the IEC 61000-3-3 and IEC 61000 4-15 Ed2.0 standards are opened, this is displayed as “Tmax.” If a test result file obtained by selecting the IEC 61000-3-3 and IEC 61000-4-15 Ed1.1 standards are opened, this is displayed as “d(t)>3.3%.” If a graph is displayed with both test data files A and B (described earlier) opened, this is displayed as “Tmax(d(t)).”
If a test result file is not open, this is displayed as “Tmax.
Set Value
The test conditions of the selected test results file is displayed.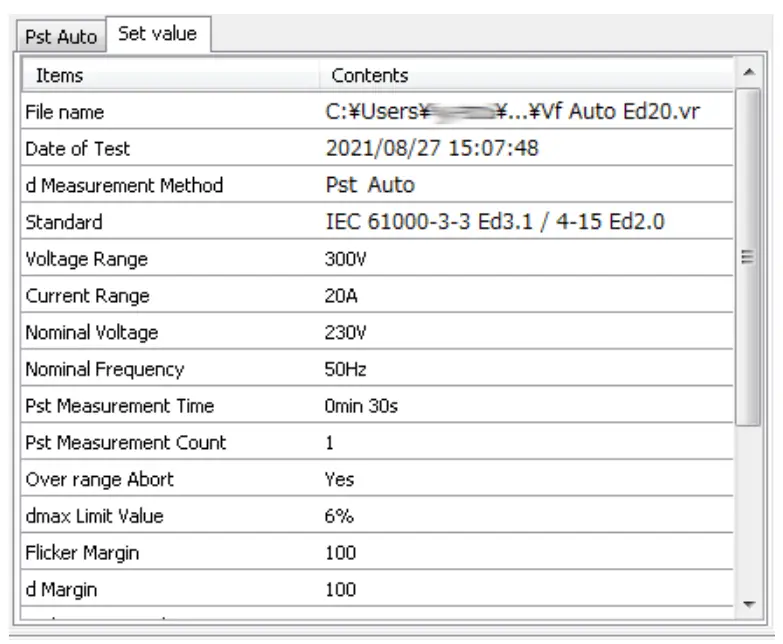
Segment Waveform Display Pane
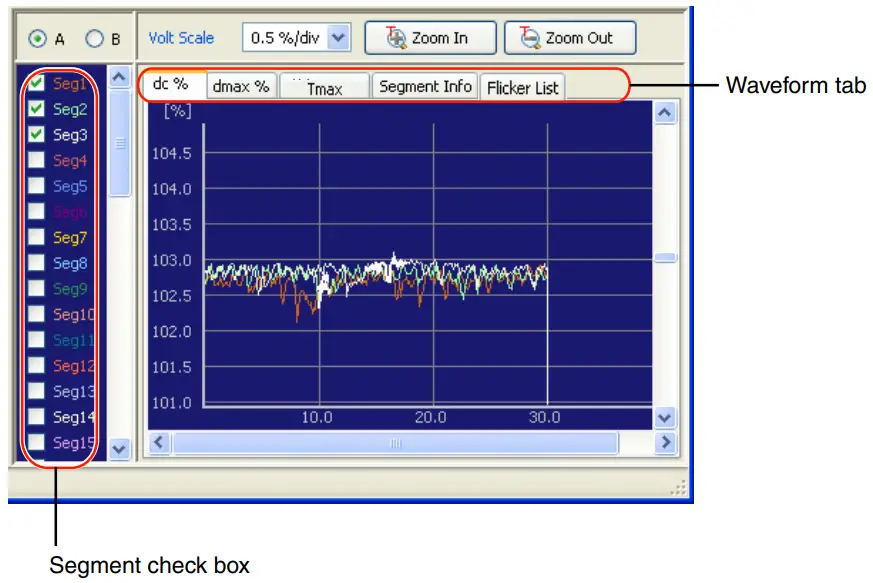
| Item | Description |
| A and B | Select the test data (A or b) that you want to display |
| Volt Scale | Used to expand or reduce the graph along the voltage fluctuation ratio axis (vertical axis). |
| Zoom In and Zoom Out | Used to expand or reduce the graph along the time axis (horizontal axis). |
| Segment check box | Select a check box to display the waveform of the corresponding segment. This feature is useful when comparing the voltage fluctuation ratios between segments. |
Waveform tab
dc, dmax, and Tmax (or d(t)>3.3%)
You can display the dc, dmax, or Tmax (or d(t)>3.3%) value of each segment by switching among them using the waveform tab.
Segment Info
| Item | Description |
| Start dc | Displays the start time of the dc in the segment. |
| Start dmax | Displays the start time of the dmax in the segment. |
| Tmax (or d(t)>3.3%) | Displays the start time of the Tmax (or d(t)>3.3%) in the segment. |
| Steady count | Displays the steady-state condition count in the segment. |
Flicker list
You can display the values of P0.1, P1s, P3s, P10s, and P50s. However, you can not use this function, if the test results file tested by the KHA1000 equipped with the firmware version prior to 1.5x.
Saving a Test Results File as Text
A test results file can be saved as text for use in Microsoft Excel and other application software.
- Click the Save Option button on the toolbar.
The Text Save Options dialog box is displayed. - Select an item to be saved as a text file.
- Click the OK button.
- In the toolbar, click the next to Save in text and select File A or File B.
The FileA(B) – Save in Text as dialog box is displayed. - Enter a file name and select file extension .txt or .csv.
- Click the Save button.
If a text file with the same name already exists, the Over Write Message is displayed
Text Save Options
Click the Save Option button on the toolbar to display the Text Save Options dialog box. In the Text Save Options dialog box, you can specify which options can be selected when you save the test results to a text file.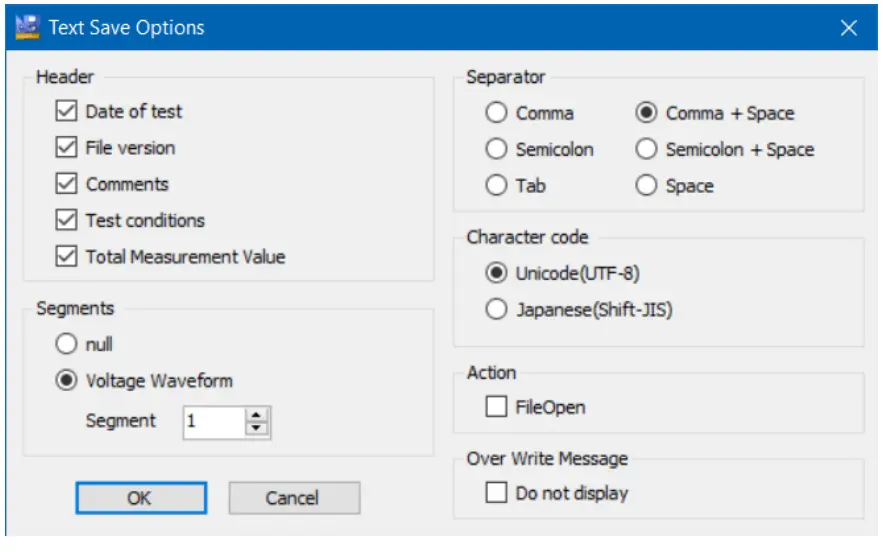
Header
Check the items that you want to save.
| Item | Description |
| Date of test | Test date |
| File version | Version of test results file |
| Comments | Information on EUT (memo, model name, type, and serial number) |
| Test conditions | Test conditions information (measurement method, standard, voltage/ current range, nominal voltage/frequency, Pst/d measurement time, Pst/d measurement count, over range abort, dmax limit values, flicker margin, and d margin) |
| Total Measurement Valu | Number of segments, measurement interval, Measured values for each segment (Number of segments, Pst value, dc (%), Tmax (or d(t)>3.3%), steady-state condition count, fluctuation dc (%) voltage, start/end time, fluctuation dmax (%) voltage, start/end time, fluctuation Tmax (or d(t)>3.3%) voltage, start/end time, and judgment result of each segment), Plt value, Plt judgment, and final judgment result |
Segments
| Item | Description |
| null | Measurement value and voltage waveform options are not selected. |
| Voltage Waveform | Measurement point (order) in the specified segment and measured value Saves voltage waveform data by specifying a segment using the combo box. |
Separator
Select the text separator.
Character code
Set the character code of a text file.
| Item | Item Description |
| Unicode (UTF-8) | Save it in a test file that supports Unicode (UTF-8). |
| apanese language (Shift-JIS) | Save it in a text file that supports the Japanese language (Shift-JIS). |
Action
After the text file is saved, you can open it with the software that text files are associated with.
Over Write Message
If you save a file with the same name already exists, a file overwrite message appears. The Do not display check box is used to enable or disable this message.
If you select the This message is not displayed next time check box in the file overwrite dialog box, the Do not display check box in the Text Save Options dialog box is also selected. If you clear the Do not display check box, the PDF file overwrite message is enabled.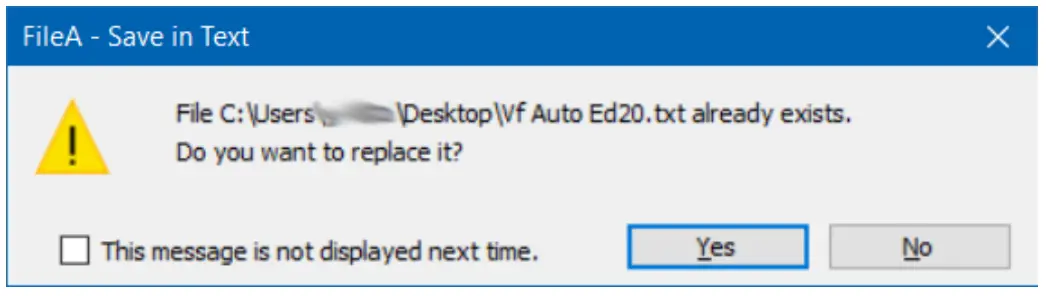
Printing a Report
Reports are printable PDF files of test result files. Numeric value data, various waveform graph, segment information and setting list can be printed. You can include comments in reports, such as the company name and test environment.
Reports are automatically saved in the same folder as test result files using the same file name as the test result file that they are converted from and a .pdf extension.
- On the results list pane, select the results file to be printed in a report.
- Open the Report Setting dialog box, and select the data, comments, Test
Information and Alias Standard to print. - Click Print.
PDF Viewer opens the report.- When a PDF file with the same name exists
The PDF Overwrite Message is displayed.
- When a PDF file with the same name exists
- Print the report.
Configuring the Report Format
In the Report Setting dialog box, you can:
- Select the data to print.
- Enable or disable the PDF file overwrite message.
Entering Comments, Test Information and Alias Standard
You can print the comments, test information, and alias standards.
The information that you enter into the boxes is registered when you click Print. Up to eight previous entries are stored in the boxes’ lists. The oldest entry is removed first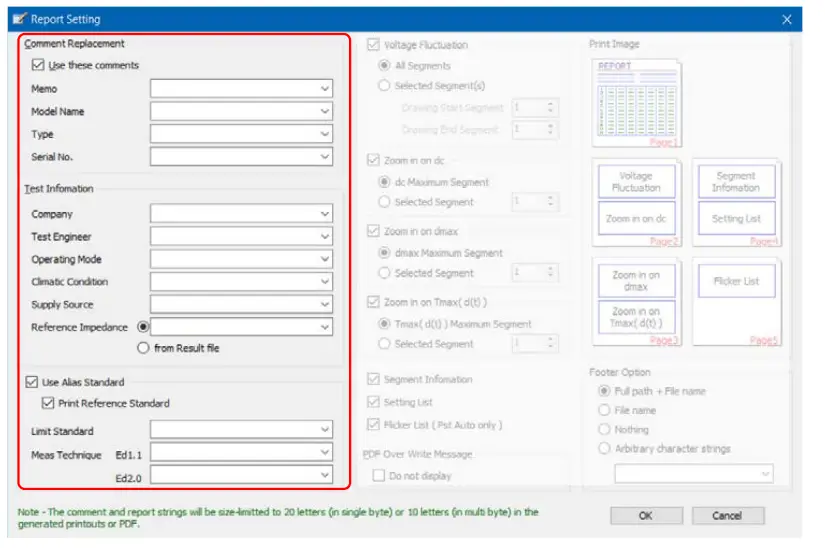
Comments
You can select which comments to print in the report: the comments included in the test results file or th e omm e tsin th e oxes list ed under th e “Us e thes e omm e ts”check ox
| Item | Description |
| Use these comments | If you select this check box, the comments in the boxes listed under this check box will be printed in the report. |
| Memo | |
| Model Name | The name of the EUT |
| Type | The model number of the EUT |
| Serial No. | The serial number of the EUT |
Test information
You cannot set the test information from the KHA1000 panel.
| Item | Description |
| Company | |
| Test Engineer | |
| Operating Mode | |
| Climatic Condition | |
| Supply Source | |
| Reference Impedance | |
Alias standard
You can enter up to 31 characters for the alias standards.
| Item | Description |
| Use Alias Standard | Select this option to print standard names other than the default standard names on the report. |
| Print Reference Standard | Select this option to print on the report the standard names also that are displayed when you select the test |
Deleting characters
Press Delete to delete a character. To clear a combo box, enter one space. If you do not enter any characters, the corresponding comment is not updated. After you close the dialog box, the previous comment will return.
Selecting which Data to Print
You can select which data and graphs to print in reports using the check boxes. After selecting which data to print, you can preview how the report will be printed.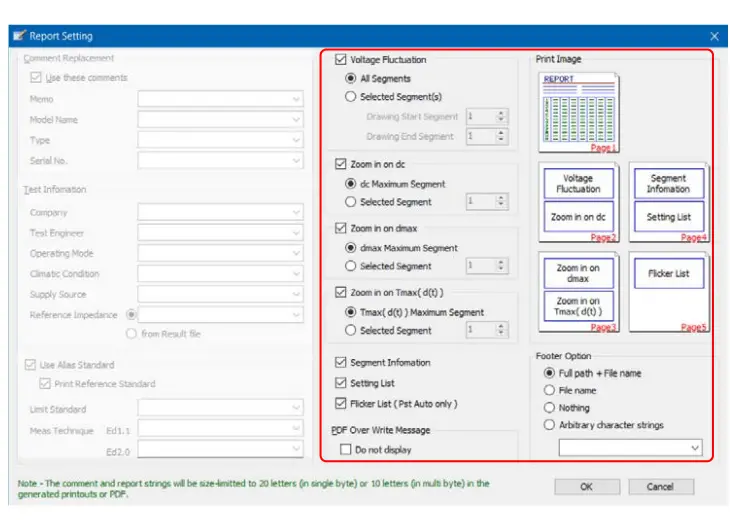
| Item | Description |
| Voltage Fluctuation | The ratios of dc, dmax, and d(t) > 3.3 % to the measurement time are printed as a voltage fluctuation waveform. You can select to print the waveform for All Segments or for Selected Segment(s). To print the waveform for a selected group of segments, specify the Drawing Start and Drawing End segments. You can select up to 24 segments. |
| Zoom in on dc | You can select to print the waveform for dc Maximum Segment or for Selected Segment. To print the waveform for a selected segment, specify the segment |
| Zoom in on dmax | You can select to print the waveform for dmax Maximum Segment or for Selected Segment. To print the waveform for a selected segment, specify the segment. |
| Zoom in on Tmax ( d(t ) ) | You can select to print the waveform for Tmax (or d(t)>3.3%) Maximum Segment or for Selected Segment. To print the waveform for a selected segment, specify the segment |
| Segment Information | Prints a segment information list. |
| Setting List | Prints a list of test conditions |
| Flicker List (Pst Auto only) | Prints the values of P0.1, P1s, P3s, P10s, and P50s. However, you can not used this function, if the test results file tested by the KHA1000 equipped with the firmware version prior to 1.5x. |
| Footer Option | Adds a footer to a report. You can select any one of Full path + File name, File name, Nothing, or Arbitrary Character Strings. The character strings that you enter in the Arbitrary Character Strings combo box are stored, when you click the OK. Up to eight of the most recent characters are stored. |
PDF Overwrite Message
If you select a test result file that you have printed before, a PDF file overwrite message appears. The Do not display check box is used to enable or disable this message.
If you select the This message is not displayed next time check box in the PDF file overwrite dialog box, the Do not display check box in the Report Setting dialog box is also selected. If you clear the Do not display check box, the PDF file overwrite message is enabled.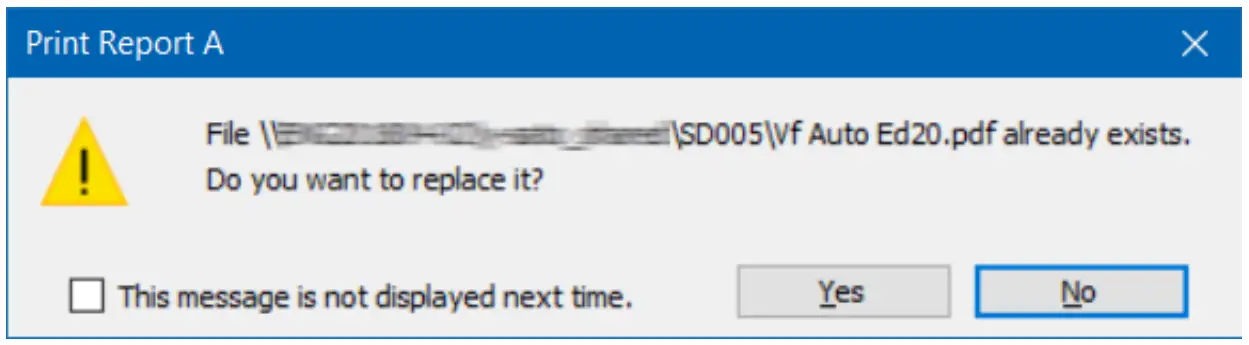
| Menu | Description |
| File | |
| Open…*1, *2 | Opens a test condition file (.vr extension) that you created using HarmoCapture or a test condition file that you saved on the KHA1000. |
| Close*1, *2 | Closes a test results file. |
| Save in text*1, *2 | Saves a test results file being selected in text or CSV format |
| Save in text As…*1, *2 | Saves a test results file in text or CSV format with another name |
| Text Save Options…*1 | You can specify which options can be selected when you save the test results to a text file. |
| Report Setting…*1 | You can specify which data and graphs to print in reports. |
| Print Report…*1, *2 | Creates a report (PDF) from a test results file and prints it. |
| Exit | Exit from Vf File Analyzer. |
| View | |
| Zoom In-main graph*1, *3 | Expands along the time axis the waveform selected. |
| Zoom Out-main graph*1, *3 | Reduces along the time axis the waveform selected. |
| Reset Horizontal Scroll*3 | Resets the waveform that had been scrolled along the time axis in the total measurement time waveform display pane to the original position. |
| Reset Voltage Offset*3 | Resets the waveform that had been moved along the voltage fluctuation ratio axis in the total measurement time waveform display pane to the original position. |
| Help | |
| User’s Manual (Japanese) | Opens the Vf File Analyzer Japanese Operation Guide. |
| User’s Manual (English) | Opens the Vf File Analyzer English Operation Guide. |
| About Vf File Analyzer… | Displays the version of Vf File Analyzer. |
Concurrent menu
| Menu | Description |
| Voltage Scale Up | Expands the graph along the voltage fluctuation ratio (vertical) axis. |
| Voltage Scale Down | Reduces the graph along the voltage fluctuation ratio (vertical) axis. |
| Zoom In | Expands the graph along the time (horizontal) axis. You can also expand the graph along the time axis by clicking Zoom In on the toolbar or by clicking View and then selecting Zoom In-main graph. |
| Zoom Out | Reduces the graph along the time (horizontal) axis. You can also expand the graph along the time axis by clicking Zoom Out on the toolbar or by clicking View and then selecting Zoom Out-main graph. |
| Search Focused dc | Adjusts the scroll position so that the dc of the segment specified by the Focus combo box is displayed at the center of the total measurement time waveform display pane |
| Search Focused dmax | Adjusts the scroll position so that the dmax of the segment specified by the Focus combo box is displayed at the center of the total measurement time waveform display pane |
| Search Focused Tmax ( d (t) ) | Adjusts the scroll position so that the Tmax (or d(t)>3.3%) of the segment specified by the Focus combo box is displayed at the center of the total measurement time waveform display pane |
| Reset Horizontal Scroll | Resets the waveform that had been scrolled along the time (horizontal) axis to the left position. You can also reset the waveform by clicking View and then selecting Reset Horizontal Scroll. |
| Reset Voltage Offset | Resets the voltage offset value along the voltage ratio (vertical) axis to zero. You can also reset the voltage offset by clicking View and then selecting Reset Voltage Offset |
| Voltage Auto Scale | The magnitude of the Volt Scale combo box is adjusted so that the waveform is shown. |
If you find any misplaced or missing pages in the manuals, they will be replaced. If the manual gets lost or soiled, a new copy can be provided for a fee. In either case, please contact your Kikusui agent or distributor. At that time, inform your agent or distributor of the “Part No.” written on the front cover of this manual.
Every effort has been made to ensure the accuracy of this manual. However, if you have any questions or find any errors or omissions, please contact your Kikusui agent or distributor.
After you have finished reading this manual, store it so that you can use it for reference at any time.
KIKUSUI ELECTRONICS CORP.
1-1-3 Higashiyamata, Tsuzuki-ku, Yokohama,
224-0023, Japan
Tel: +81-45-482-6353 Fax: +81-45-482-6261
QR code