HMS Interim report 2020
This is a translation of the Swedish language original. In the event of any differences between this translation and the Swedish original, the latter shall prevail.
Comment from the CEO
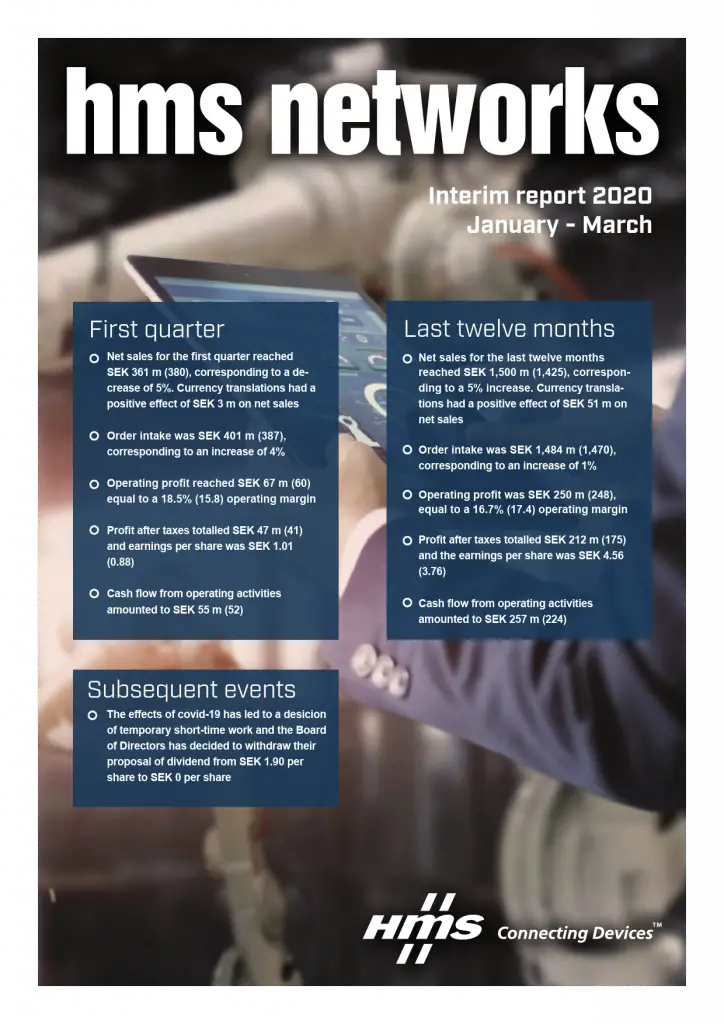
Although the first quarter of the year has been dramatic in most parts of the world, HMS’ operations has not been affected to a larger extent. We have had a good order intake, solved challenges in our supply chain and been able to deliver products to our customers. Despite the challenging market situation, the quarter generally shows a positive development. Order intake amounted to SEK 401 m, an increase of 4% compared to the corresponding period last year, partly driven by customers increasing their inventory during these uncertain times. Sales amounted to SEK 361 m, a decrease of 5% compared to the corresponding period last year. Underlying organic growth declined by 8%, but this is partially compensated by last year’s acquisitions and the continued weakening of the Swedish krona.
The quarter shows a strong gross margin slightly above 62%, which is a significant improvement compared to the corresponding quarter last year. The gross margin for the quarter is a result of internal efficiency improvements and a favourable product mix. A strong gross margin and the previously implemented cost-savings program resulted in an operating profit for the quarter of SEK 67 m, corresponding to an operating margin of 19%. During the quarter we have seen negative organic growth for our brands Anybus, Ixxat and Intesis. On the other hand, we see positive development for the Ewon brand under which we offer solutions for remote monitoring of machines – an offering which may have received an extra boost during these times when it is difficult for service technicians to travel. For Intesis, we have seen some disruptions in our supply chain, since Spanish authorities imposed restrictions due to covid-19, that affected our manufacturing in Spain. Otherwise, we have been able to continue production and deliveries of products according to plan.
We see a continued slowdown in the market situation in Central Europe, primarily driven by a decline in Germany. In Asia, the year started with growth mainly in Japan, but this was against a weak comparable figure from 2019. In North America, we see a sideways market development with sales on the same level as corresponding quarter in 2019. In general, there is great uncertainty about the future and how the corona crisis will impact the demand from our customers in the coming quarters and the rest of 2020. We continue to see good cash flow, which strengthens our financial position. We have reduced our net debt to SEK 390 m and have a equity ratio of 59%, which means that we are well prepared for the challenging situation we will most likely have for a number of months to come
During the fall of 2019, a cost-savings program was implemented aimed to continue investments in segments with growth potential and strengthen cost control in areas with weaker growth outlook. This program has worked well and resulted in the savings we expected. Our assessment is that Automation and Digitalization of industrial processes will see an increased demand when we have the corona crisis behind us. HMS will then be ready to meet this demand with competitive products and solutions. The second quarter has started with a decline in order intake of about 20% compared to the corresponding period last year and we expect the coming months and quarters to be challenging for our customers. We are therefore working to reduce our costs in the short term in order to cope with the corona crisis in the best possible way, but at the same time to be ready to expand when we see that our markets are beginning to recover. The company’s management and board have therefore decided to implement short-time work and a revocation of the board’s proposal for a dividend.
We have recently initiated temporary short-time work for our employees where we cut down working hours to 80% for the majority of staff in Sweden and Germany, where we have about 2/3 of the Group’s employees. This will continue until we see a clearer picture of how our markets are developing. Despite the turbulence in the short term, we continue to focus on long-term growth and a balanced view of our costs. In the long term, we continue to believe that the market for industrial communication will be an interesting growth area and we will continue to focus on our motto “Connecting Devices”.
The first quarter of the year has been dramatic in most parts of the world but has not affected our operations to any significant extent. We have been able to continue delivering products to our customers and have succeeded in solving challenges in our supply chain.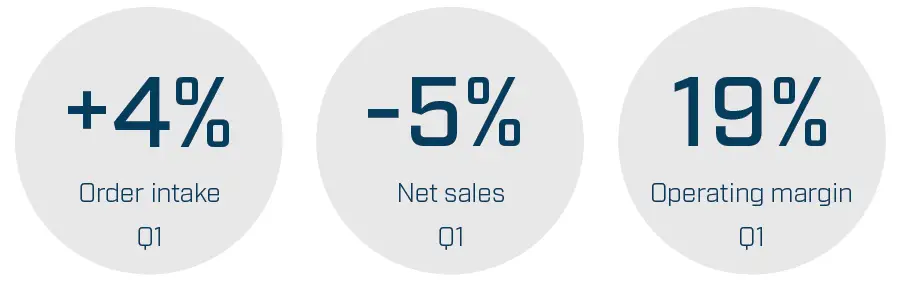
Order intake, net sales and earnings
First quarter
Order intake increased by 4% to SEK 401 m (387) of which currency translations affected positively by SEK 19 m. The companies acquired last year have contributed to the order intake with SEK 9 m. The organic decrease in order intake was 4%.
Net sales decreased by 5% to SEK 361 m (380), of which currency translation effects affected positively by SEK 3 m (25). The acquired companies have contributed to the net sales with SEK 7 m. The organic decrease in net sales was 8%.
Gross profit reached SEK 225 m (225) corresponding to a gross margin of 62.4% (59.3). Operating expenses decreased in total by SEK 6 m to SEK 159 m (165). The organic decrease in operating expenses was 8%, corresponding to SEK 14 m.
Operating profit before depreciation amounted to SEK 90 m (79), corresponding to a margin of 25.0% (20.9). Depreciations amounted to SEK 23 m (19). Operating profit amounted to SEK 67 m (60) corresponding to a margin of 18.5% (15.8). Currency translations have affected operating profit positively by SEK 4 m (8). The acquired companies have had a limited impact on the operating profit.Net financials was SEK -4 m (-4), which gave a profit before tax of SEK 63 m (56).
Profit after tax amounted to SEK 47 m (41) and earnings per share before and after dilution was SEK 1.01 (0.88) and SEK 1.01 (0.87) respectively.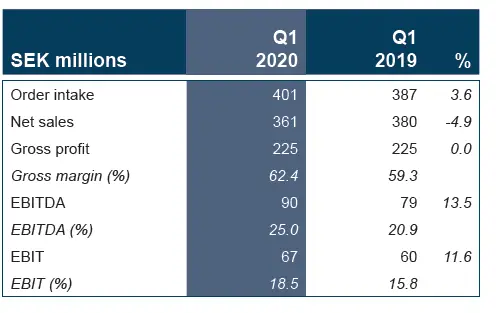
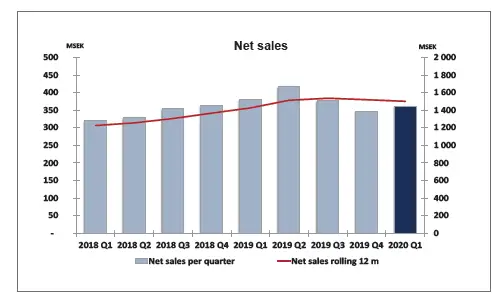 The graph shows turnover per quarter on the bars referring to the scale on the left axis. The line shows turnover for the latest 12 month period referring to the scale on the axis to the right.
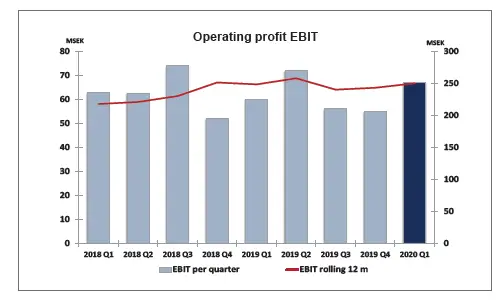 The graph shows operating result EBIT per quarter. The bars refer to the scale on the left axis. The line shows operating result for the last 12 month period referring to the scale on the axis to the right.
| Quarterly data¹ | Q1 2020 | Q4 2019 | Q3 2019 | Q2 2019 | Q1 2019 | Q4 2018 | Q3 2018 | Q2 2018 |
| Order intake (SEK m) | 401 | 337 | 372 | 375 | 387 | 387 | 360 | 336 |
| Net sales (SEK m) | 361 | 346 | 377 | 416 | 380 | 363 | 353 | 329 |
| Gross margin (%) | 62.4 | 61.2 | 62.8 | 61.2 | 59.3 | 59.6 | 60.3 | 62.8 |
| EBITDA (SEK m) | 90 | 78 | 82 | 94 | 79 | 65 | 87 | 75 |
| EBITDA (%) | 25.0 | 22.6 | 21.7 | 22.6 | 20.9 | 17.9 | 24.5 | 22.9 |
| EBIT (SEK m) | 67 | 55 | 56 | 72 | 60 | 52 | 74 | 63 |
| EBIT (%) | 18.5 | 15.9 | 14.9 | 17.3 | 15.8 | 14.3 | 20.9 | 19.0 |
| Cash flow from operating activities per share (SEK) | 1.18 | 1.30 | 1.93 | 1.10 | 1.11 | 1.05 | 1.57 | 1.08 |
| Earnings per share before dilution (SEK) | 1.01 | 1.46 | 0.98 | 1.10 | 0.88 | 0.90 | 1.09 | 0.90 |
| Earnings per share before after dilution (SEK) | 1.01 | 1.46 | 0.98 | 1.09 | 0.87 | 0.89 | 1.08 | 0.89 |
| Equity per share (SEK) | 22.49 | 21.06 | 19.88 | 19.42 | 18.96 | 17.98 | 17.13 | 16.88 |
All quarters of 2019 and 2020 are effected by IFRS 16 Leases.
Cash flow, investments and financial position
Cash flow from operating activities before changes in working capital amounted to SEK 84 m (60) for the first quarter of the year. Changes in working capital was SEK -29 m (-9), explained by an increase in accounts receivable. Cash flow from operating activities was thereby SEK 55 m (52). Cash flow from investing activities was SEK -14 m (-11), which corresponds to new investments in intangible and tangible assets. Cash flow from financing activities was SEK -29 m (-9), which is mainly explained by a decrease in external loans of SEK 15 m (1). Moreover, amortizations of lease liabilities by SEK 9 m (8). Additionally, re-purchase of own shares by SEK 6 m (-). This means that cash flow for the quarter was SEK 12 m (32).
Cash and cash equivalent and net debt
Cash and cash equivalents amounted to SEK 67 m (93) and unused credit facilities to SEK 203 m (162). Net debt amounted to SEK 390 m (409), whereof SEK 111 m (119) corresponds to lease liabilities. Net debt to EBITDA ratio for the last twelve months was 1.13 (1.33). Net debt/Equity ratio was 36% (45) and Equity/Assets ratio 59% (52).
The HMS Networks AB share
HMS Networks AB (publ) is listed on the Nasdaq OMX Stockholm Mid Cap list, in the Information Technology sector. By the end of the period the total number of shares amounted to 46,818,868 of which 154,916 shares are held by the company. A list of the company’s ownership structure can be found on the company’s website (www.hms-networks.com).
Annual General Meeting and dividend
The Annual General Meeting will be held at the Company’s premise on Thursday, April 23, 2020 at 10.30 CET. Due to the current situation of the spread of infection of covid-19, measures will be taken to ensure the health and security of our shareholders and employees. Therefore, the annual general meeting will be shortened and the participation of the board and management limited. The CEO’s speech will be published on the website. The estimation is that the meeting can be held in a manner that follows the rules and recommendations from the government and the Public Health Agency of Sweden.
Due to the same reason, namely the uncertain economic consequences that may arise due to the spread of covid-19, the Board of directors decided, on April 14, 2020, to withdraw the previously communicated proposal to the Annual General Meeting 2020 of a dividend of SEK 1.90 per share to a SEK 0 per share.
Share savings program
The Company has four ongoing share saving programs today. Based on a decision by the Annual General Meetings permanent employees are offered to save in HMS shares in an annual share saving program. Between 41% and 52% of the employees opted to participate in the respective program. If certain criterias are met the Company is committed to give the participant a maximum of two HMS shares for every share saved by the employee. As of March 31, 2020, the total number of saved shares amounted to 109,165 (125,326) within ongoing programs. On December 31, 2019 the share saving program from 2016 was finalized. During the first quarter of 2020, 88,083 shares, of which 44,002 performance shares, were distributed free of charge to the participants. Shares used for the allocation was own shares held by the company.
The parent company
The Parent Company’s operations are primarily focused on Group wide management and financing. Apart from the Group’s CEO, the Parent Company has no employees. The operating profit for the first quarter amounted to SEK 0 m (0). The profit for the period amounted to SEK 6 m (1) after tax. Cash and cash equivalents amounted to SEK 1 m (1), external borrowing does not exist.
Related party transactions
No material transactions with related parties have occurred during the period.
Contingent liabilities
There have been no changes in the Group’s contingent liabilities, described on page 100 in Note 36 of the Annual Report for 2019.
Significant events
In the first quarter, the world was affected by covid-19, a virus pandemic with effects that no one could have anticipated, which will affect HMS. In the first quarter, however, we only saw a limited impact on the business and a number of measures have been implemented in the short-term to counteract the effects such as increased control over liquidity, working capital and costs.
Subsequent events
At present, there is great uncertainty about how HMS markets will develop in 2020. We still assume that the ongoing spread of covid-19 will have a negative impact on our customers and suppliers, but it is currently not possible to assess the extent of how HMS will be affected. To compensate for the decline expected to occur, HMS has decided to implement short-time work for the majority of the employees in Sweden and Germany to approximately 80% starting in April and until further notice.
Outlook
The HMS Group’s long-term growth is supported by a continued inflow of Design-Wins, a broader product offering within the Industrial Internet of Things (IIoT) and Wireless, supplementary technology platforms from earlier acquisitions, and expansion of the HMS sales channels according to the existing strategy. Due to covid-19, the global business climate is considered to be considerably weakened and will probably create challenges for our growth ambitions in the short-term. Underlying economic climate in various geographical areas and industrial segments and its impact on the market for HMS’ product offering is also difficult to estimate for the same reason. The currency development will play an important role and also this effect is difficult to estimate. HMS’ long-term goals are unchanged: Long-term growth on average 20% per year and an operating margin of 20%.
Risk management
The HMS Group is exposed to business and financial risks through its operations. These risks have been described at length in the Company’s Annual Report 2019. As previously mentioned, the world has been affected by a pandemic with effects that no one could have foreseen and it is currently impossible to estimate the extent of the negative impact that covid-19 could have on the Group. HMS monitors developments closely and is prepared to take further actions where necessary to reduce the negative effects on the business. The Group acts in accordance with decisions and recommendations from governments and authorities in each market and with the employees’ health and well-being as the highest priority.
Accounting policies
HMS’ consolidated accounts have been prepared in accordance with the International Financial Reporting Standards (IFRS), adopted by the EU. The Interim Report has been prepared in accordance with IAS 34 Interim Financial Reporting and the Swedish Annual Accounts Act. The Parent Company applies Swedish Financial Reporting Board’s recommendation, RFR 2 Accounting for Legal Entities, and the Swedish Annual Accounts Act.
The accounting principles applied conform to those described in the 2019 Annual Report. Other new or revised IFRS standards or other IFRIC-interpretations that came into effect after January 1, 2020 have not had any significant impact on the Group’s financial reports as of March 31, 2020. HMS applies the European Securities and Market Authority’s (ESMA) guidelines on alternative key indicators (measures that are not defined in accordance with IFRS).
Short about the company
Strategies
GROWTH STRATEGY – HMS Networks focuses primarily on organic growth, where expansion in existing markets is done through a continuously improved and expanded product offering, often including new technology. This is combined with a high level of service and active investments in new sales channels globally. New markets are addressed with innovative and targeted solutions. Growth can also be generated through selective acquisitions of businesses with complementary offerings.
DEVELOPMENT STRATEGY – The Company’s core competence is the broad and deep knowledge of industrial communication and IIoT, Industrial Internet of Things. A clear platform strategy ensures that all development centers within HMS are using core HMS technology.
PRODUCT STRATEGY – HMS offers solutions for industrial communication and IIoT under the trademarks Anybus®, Ewon®, Ixxat® and Intesis™.
- Anybus – connection of automation products and machines to industrial networks and IIoT applications, through embedded network cards, gateways and wireless solutions
- Ewon – remote access, data collection, monitoring and control of machines as well as other industrial applications
- Ixxat – communication within machines and smart grids, solutions for functional safety as well as automotive testing
- Intesis – communication solutions for building automation, primarily within HVAC (heating, ventilation and air conditioning)
PRODUCTION STRATEGY – Flexible low volume production in own factories in Halmstad, Nivelles and Igualada is combined with high volume production in Europe and Asia in close collaboration with carefully selected subcontractors.
MARKETING STRATEGY – HMS’ markets its solutions to several customer segment in the industrial value chain. Device manufacturers and machine builders are offered solutions that are tightly integrated into the customer’s application. System integrators and end users are offered flexible infrastructure products that solve all kinds of communication problems in industrial systems and IoT applications. HMS’ most important market is still factory automation, but other important markets are energy and infrastructure, transport and logistics, and building automation.
SALES STRATEGY – HMS combines direct sales from own sales offices with sales through distribution. HMS has sales offices in key markets in 14 countries, complemented by a network of distributors and solution partners in more than 50 countries.
Business model
HMS has developed its business models by packaging advanced industrial communication and IIoT technology into targeted solutions for each targeted customer group. With device manufacturers and machine builders, HMS signs long-term framework agreements, so-called Design-Wins. This model is characterized by a relatively long sales cycle and design phase during which HMS’s solutions are specified into the customer’s application, after which long-term revenues are secured. The close collaboration gives HMS clear insight into the customer’s future needs. The business model towards system integrators is more traditional with a short sales cycle and manufacturing against customer orders or short-term forecasts. This sale is often handled by local distributors who are supported by HMS’ sales and marketing organization.
Audit review
This interim report has not been reviewed by the Company’s auditors.
Report occasions
- Annual General Meeting will be held on April 23, 2020
- Half-year report 2020 will be published on July 15, 2020
- Third quarter report 2020 will be published on October 23, 2020
- Year-end report 2020 will be published in January/February, 2021
Halmstad April 23, 2020
Staffan Dahlström
Chief Executive Officer
Further information can be obtained by:
Staffan Dahlström, CEO, +46 (0)35 17 2901
Joakim Nideborn, CFO, +46 (0)35 710 6983
This information is such that HMS Networks AB (publ) is obliged to make public pursuant to the EU Market Abuse Regulation and the Securities Markets Act. The information was submitted for publication, through the contact persons set out above, at 08.00 CET on April 23, 2020.
Income statements
| SEK millions | Q1 2020 | Q1 2019 | 1904-2003 12 months | Q1-Q4 2019 |
| Net sales | 361 | 380 | 1,500 | 1,519 |
| Cost of goods and services sold | -136 | -155 | -572 | -591 |
| GROSS PROFIT | 225 | 225 | 928 | 928 |
| Sales and marketing expenses | -86 | -79 | -355 | -349 |
| Administrative expenses | -31 | -31 | -123 | -124 |
| Research and development expenses | -43 | -50 | -182 | -190 |
| Restructuring expenses¹ | – | – | -22 | -22 |
| Other operating income² | 1 | 0 | 21 | 20 |
| Other operating expenses³ | – | -5 | -15 | -20 |
| OPERATING PROFIT | 67 | 60 | 250 | 243 |
| Financial income and expenses | -4 | -4 | -15 | -15 |
| Profit before tax | 63 | 56 | 235 | 228 |
| Tax | -15 | -15 | -23 | -23 |
| PROFIT FOR THE PERIOD | 48 | 41 | 212 | 205 |
| Attributed to: |
47 |
41 |
212 |
206 |
| Parent company shareholders | ||||
| Non-controlling interests | 0 | – | -1 | -1 |
| Earnings per share regarding profit attributed to parent company shareholders |
1.01 |
0.88 |
4.56 |
4.43 |
| Before dilution, SEK | ||||
| After dilution, SEK | 1.01 | 0.87 | 4.54 | 4.40 |
- Restructuring expenses for 2019 are allocated as follows: Cost of goods and services sold SEK 6 m, Sales and marketing expenses SEK 9 m, Administrative expenses SEK 4 m and Research and development expenses SEK 3 m.
- Other operating income for 2019 mainly corresponds to the settlement of contraced supplemental purchase price related to Beck IPC.
- Other operating expenses for 2019 mainly corresponds to realized currency forward hedging, SEK -2 m in Q1 and SEK -14 m for the full year. From January 1, 2020, realized currency forward hedges are reported gross.
Statement of comprehensive income
| SEK millions | Q1 2020 | Q1 2019 | 1904-2003 12 months | Q1-Q4 2019 |
| Profit for the period | 48 | 41 | 212 | 205 |
| Other comprehensive income |
-16 |
-5 |
-8 |
4 |
| Items that may be reclassified subsequently to income statement | ||||
| Cash flow hedges | ||||
| Hedging of net investments | -18 | -4 | -16 | -2 |
| Translation differences | 62 | 18 | 59 | 15 |
| Income tax relating to components of other comprehensive income | 7 | 2 | 5 | 0 |
| Other comprehensive income for the period, net of tax | 35 | 11 | 40 | 16 |
| Total comprehensive income for the period | 82 | 52 | 252 | 221 |
| Attributed to: |
82 |
52 |
253 |
223 |
| Parent company shareholders | ||||
| Non-controlling interests | 0 | – | -1 | -1 |
Balance sheets
|
SEK millions |
Mar 31 2020 |
Mar 31 2019 |
Dec 31 2019 |
| ASSETS |
916 | ||
| Goodwill | 849 | 876 | |
| Other intangible assets | 302 | 251 | 290 |
| Property, plant and equipment | 45 | 36 | 45 |
| Right-of-use assets | 110 | 120 | 111 |
| Deferred tax assets | 4 | 7 | 4 |
| Other long term receivables | 9 | 8 | 9 |
| Total fixed assets | 1,386 | 1,273 | 1,335 |
| Inventories | 153 | 159 | 159 |
| Accounts receivable – trade | 184 | 176 | 143 |
| Other current receivables | 67 | 48 | 69 |
| Cash and cash equivalents | 67 | 93 | 51 |
| Total current assets | 471 | 475 | 442 |
| TOTAL ASSETS | 1,856 | 1,748 | 1,758 |
| EQUITY AND LIABILITIES |
1,075 | ||
| Equity attributed to parent company shareholders | 910 | 998 | |
| Non-controlling interests | 13 | – | 12 |
| Total Equity | 1,088 | 910 | 1,010 |
| Liabilities | 334 | ||
| Non-current interest-bearing liabilities | 361 | 339 | |
| Non-current lease liabilities | 80 | 89 | 82 |
| Deferred income tax liabilities | 71 | 77 | 77 |
| Total non-current liabilities | 484 | 527 | 498 |
| Current interest-bearing liabilities | 12 | 21 | 1 |
| Current lease liabilities | 31 | 30 | 31 |
| Accounts payable – trade | 79 | 106 | 76 |
| Other current liabilities | 162 | 153 | 142 |
| Total current liabilities | 284 | 310 | 249 |
| TOTAL EQUITY AND LIABILITIES | 1,856 | 1,748 | 1,758 |
Cash flow statements
| SEK millions | Q1 2020 | Q1 2019 | 1904-2003 12 months | Q1-Q4 2019 |
| Cash flow from operating activities before changes in working capital | 84 | 60 | 287 | 264 |
| Cash flow from changes in working capital | -29 | -9 | -30 | -10 |
| Cash flow from operating activities | 55 | 52 | 257 | 254 |
| Cash flow from investing activities | -14 | -11 | -95 | -92 |
| Cash flow from financing activities | -29 | -9 | -193 | -173 |
| Cash flow for the period | 12 | 32 | -31 | -12 |
| Cash and cash equivalents at beginning of the period | 51 | 59 | 93 | 59 |
| Translation differences in cash and cash equivalents | 4 | 2 | 6 | 4 |
| Cash and cash equivalents at end of period | 67 | 93 | 67 | 51 |
| Interest-bearing liabilities | 457 | 501 | 457 | 453 |
| Net debt | 390 | 409 | 390 | 402 |
- The acquisition of WEBfactory’s impact on the Group’s cash and cash equivalents, after deduction of WEBfactory’s cash and cash equivalents, amounted to SEK 13 m in Q2 2019.
- The acquisition of Raster’s impact on the Group’s cash and cash equivalents, after deduction of Raster’s cash and cash equivalents, amounted to SEK -12 m in Q2 2019.
Equity
| Change in Group Equity, SEK millions |
Mar 31 2020 |
Mar 31 2019 |
Dec 31 2019 |
| Opening balance at January 1 | 998 | 857 | 857 |
| Total comprehensive income for the period | 82 | 52 | 223 |
| Share-related payment | 1 | 2 | 3 |
| Repurchase of own shares | -6 | – | – |
| Dividends | – | – | -84 |
| Closing balance attributed to parent company share- holders | 1,075 | 910 | 998 |
| Non-controlling interest arising from acquisition of sub- sidiaries | 13 | – | 12 |
| Closing balance | 1,088 | 910 | 1,010 |
Financial accounts
| Q1 2020 | Q1 2019 | 1904-2003 12 months | Q1-Q4 2019 | |
| Net increase in net sales (%) | -4.9 | 18.6 | 5.2 | 11.2 |
| Gross margin (%) | 62.4 | 59.3 | 61.9 | 61.1 |
| EBITDA (SEK m) | 90 | 79 | 344 | 334 |
| EBITDA (%) | 25.0 | 20.9 | 23.0 | 22.0 |
| EBIT (SEK m) | 67 | 60 | 250 | 243 |
| EBIT (%) | 18.5 | 15.8 | 16.7 | 16.0 |
| Return on capital employed (%) | – | – | 17.0 | 17.2 |
| Return on Shareholder’s equity (%) | – | – | 21.9 | 22.3 |
| Working capital in relation to sales (%) | – | – | 10.3 | 9.5 |
| Capital turnover rate | – | – | 0.83 | 0.87 |
| Net debt/equity ratio | 0.36 | 0.45 | 0.36 | 0.40 |
| Equity/assets ratio (%) | 58.6 | 52.1 | 58.6 | 57.5 |
| Investments in tangible fixed assets (SEK m) | 2 | 7 | 20 | 25 |
| Investments in right-of-use assets (SEK m) | 2 | 6 | 20 | 24 |
| Investments in intangible fixed assets (SEK m) | 13 | 4 | 50 | 42 |
| Depreciation of tangible fixed assets (SEK m) | -3 | -3 | -15 | -15 |
| Depreciation of right-of-use assets (SEK m) | -8 | -8 | -31 | -29 |
| Amortization of intangible fixed assets (SEK m) | -12 | -9 | -48 | -46 |
| Of which amortization of overvalues acquired | -5 | -3 | -17 | -16 |
| Of which amortization of capitalized development costs | -7 | -6 | -31 | -30 |
| Number of employees (average) | 612 | 587 | 623 | 617 |
| Net sales per employees (SEK m) | 0.59 | 0.65 | 2.4 | 2.5 |
| Equity per share (SEK) | 22.49 | 18.96 | 20.84 | 19.87 |
| Cash flow from operations per share (SEK) | 1.18 | 1.11 | 5.51 | 5.45 |
| Total number of share average (thousands) | 46,819 | 46,819 | 46,819 | 46,819 |
| Holding of own shares average (thousands) | 179 | 248 | 193 | 221 |
| Total outstanding shares average (thousands) | 46,640 | 46,571 | 46,625 | 46,598 |
Quarterly data
| Division of income per brand SEK millions | Q1 2020 | Q4 2019 | Q3 2019 | Q2 2019 | Q1 2019 | Q4 2018 | Q3 2018 | Q2 2018 |
| Anybus | 211 | 184 | 213 | 251 | 225 | 211 | 209 | 183 |
| Ixxat | 43 | 42 | 42 | 44 | 48 | 44 | 45 | 39 |
| Ewon | 76 | 75 | 70 | 74 | 73 | 67 | 63 | 70 |
| Intesis | 21 | 34 | 29 | 28 | 25 | 24 | 25 | 25 |
| Other | 10 | 11 | 22 | 19 | 8 | 18 | 11 | 12 |
| Total | 361 | 346 | 377 | 416 | 380 | 363 | 353 | 329 |
All brands are based on a common technology platform and are marketed and sold in common sales channels. Therefore, no complete segment follow-up is reported.
| Net sales per region SEK millions | Q1 2020 | Q4 2019 | Q3 2019 | Q2 2019 | Q1 2019 | |||
| EMEA | 214 | 218 | 236 | 256 | 240 | 222 | 220 | 208 |
| Americas | 87 | 76 | 80 | 81 | 84 | 81 | 75 | 67 |
| Asia | 60 | 52 | 61 | 79 | 55 | 60 | 58 | 54 |
| Total | 361 | 346 | 377 | 416 | 380 | 363 | 353 | 329 |
| Income statement SEK millions | Q1 2020 | Q4 2019 | Q3 2019 | Q2 2019 | Q1 2019 | |||
| Net sales | 361 | 346 | 377 | 416 | 380 | 363 | 353 | 329 |
| Gross profit | 225 | 212 | 236 | 254 | 225 | 216 | 213 | 206 |
| Gross margin (%) | 62.4 | 61.2 | 62.8 | 61.2 | 59.3 | 59.6 | 60.3 | 62.8 |
| Operating profit | 67 | 55 | 56 | 72 | 60 | 52 | 74 | 63 |
| Operating margin (%) | 18.5 | 15.9 | 14.9 | 17.3 | 15.8 | 14.3 | 20.9 | 19.0 |
| Profit before tax | 63 | 47 | 55 | 70 | 56 | 52 | 70 | 58 |
Parent company’s income statement
| SEK millions | Q1 2020 | Q1 2019 | 1904-2003 12 months | Q1-Q4 2019 |
| Net sales | 4 | 4 | 16 | 16 |
| Gross profit | 4 | 4 | 16 | 16 |
| Administrative expenses | -4 | -4 | -16 | -16 |
| Operating profit | – | – | – | – |
| Profit from participations in subsidiaries | – | – | 179 | 179 |
| Interest income/ expenses and similar items | 6 | 1 | 7 | 2 |
| Profit before tax | 6 | 1 | 186 | 181 |
| Tax | – | – | -1 | -1 |
| Profit for the period | 6 | 1 | 186 | 181 |
Parent company’s balance sheet
| SEK millions | Mar 31 2020 | Mar 31 2019 | Dec 31 2019 |
| ASSETS |
337 | ||
| Financial assets | 337 | 337 | |
| Total financial assets | 337 | 337 | 337 |
| Receivables from Group companies | 102 | 65 | 96 |
| Other receivables | 1 | 1 | 0 |
| Cash and cash equivalents | 1 | 1 | 1 |
| Total current assets | 103 | 67 | 97 |
| TOTAL ASSETS | 441 | 404 | 434 |
| EQUITY AND LIABILITIES |
299 | ||
| Equity | 203 | 299 | |
| Current liabilities | 0 | ||
| Accounts payable – trade | 1 | 0 | |
| Liabilities to Group companies | 136 | 196 | 128 |
| Other current liabilities | 5 | 5 | 7 |
| Total current liabilities | 142 | 202 | 135 |
| TOTAL EQUITY AND LIABILITIES | 441 | 404 | 434 |
Definitions
NUMBER OF OUTSTANDING SHARES
The number of registered shares, less repurchased own shares that are held as treasury shares.
RETURN ON SHAREHOLDER’S EQUITY
Share of the profit after tax attributable to the parent company shareholders in relation to the average of Shareholder’s equity.
RETURN ON CAPITAL EMPLOYED
Profit after financial income in relation to the average capital employed.
EBIT
Operating income according to income statement.
EBITDA
Operating profit excluding depreciation and amortization of tangible and intangible assets.
EQUITY PER SHARE
Average equity attributable to the Parent Company’s shareholders divided by the number of outstanding shares at the end of the period.
FINANCIAL ASSETS
Long-term and short-term financial receivables plus cash and cash equivalents.
AVERAGE NUMBER OF OUTSTANDING SHARES
The average number of registered shares less repurchased own shares that are held as treasury shares.
CAPITAL TURNOVER
Net sales in relation to average balance sheet total.
CASH FLOW FROM OPERATING ACTIVITIES PER SHARE
Cash flow from operating activities in relation to the average number of outstanding shares.
NET DEBT
Long-term and current interest-bearing financial liabilities less financial assets.
NET DEBT/EQUITY RATIO
Net debt in relation to Shareholders’ equity.
WORKING CAPITAL
Current assets less cash and cash equivalents and current liabilities calculated on average values.
OPERATING MARGIN
Operating profit in relation to net sales.
EQUITY/ASSETS RATIO
Shareholders’ equity in relation to total assets.
CAPITAL EMPLOYED
Total assets less non-interest-bearing current liabilities, provisions, and total deferred tax liabilities.
EARNINGS PER SHARE, UNDILUTED
Share of the profit after tax attributable to the parent company shareholders in relation to the average number of outstanding shares.
EARNINGS PER SHARE, DILUTED
Share of the profit after tax attributable to the parent company shareholders in relation to the average number of outstanding shares plus an adjustment for the average number of shares that are added when converting the outstanding number of convertibles and options.
Alternative key ratios
HMS presents certain financial measures in the interim report that has not been defined in accordance with IFRS. The company considers that these measures provide valuable additional information for investors and the company’s management, as they enable the evaluation of relevant trends and the company’s performance. As not all companies calculate financial measures in the same way, these are not always comparable with the measures used by other companies. These financial measures should therefore not be viewed.
| SEK millions | Q1 2020 | Q1 2019 | 1904-2003 12 months | Q1-Q4 2019 |
| Operating profit | 67 | 60 | 250 | 243 |
| Depreciation/amortization | 23 | 19 | 94 | 90 |
| EBITDA | 90 | 79 | 344 | 334 |
HMS Networks AB (publ) is the leading independent supplier of solutions for industrial communication and the Industrial Internet of Things. HMS develops and manufactures products under the Anybus®, Ixxat®, Ewon® and Intesis™ brands. Development takes place at the headquarters in Halmstad, Ravensburg, Nivelles, Igualada, Wetzlar and Buchen. Local sales and support are handled by branch offices in Germany, USA, Japan, China, Singapore, Italy, France, Spain, the Netherlands, India, UK, Sweden, South Korea and UAE, as well as through a worldwide network of distributors and partners. HMS employs over 600 people and reported sales of SEK 1,519 million in 2019. HMS is listed on the NASDAQ OMX in Stockholm, category Mid Cap, Information Technology.
Our vision
“In a world where all devices are intelligent and networked… HMS is the leader in making industrial devices and systems communicate – for a more productive and sustainable world.”.
Our mission
“We drive innovation in collaboration with partners and customers creating leading technologies, products and solutions bringing value to real-world challenges”.
HMS Networks AB (publ)
Org.Nr. 556661-8954
Box 4126 | 300 04 Halmstad | Sweden
Tel: +46 35 17 29 00
[email protected]
www.hms-networks.com/ir![]()


