
Moku Go ![]()
![]() Oscilloscope / Voltmeter
Oscilloscope / Voltmeter
Portable Hardware Platform
User Manual
Portable Hardware Platform
The Moku: Go Oscilloscope can be used to observe, analyze, measure, and record signals over time on two channels, with an analog bandwidth of 30 MHz and a sampling rate up to 125 MSa/s.
Oscilloscopes are essential in any electronics lab. The Moku: Go user interface enables efficient control and setup of the Oscilloscope and the built-in Waveform Generator provides a convenient test stimulus.
Additionally, a wide range of measurements are available together with a computed Math channel.
User interface
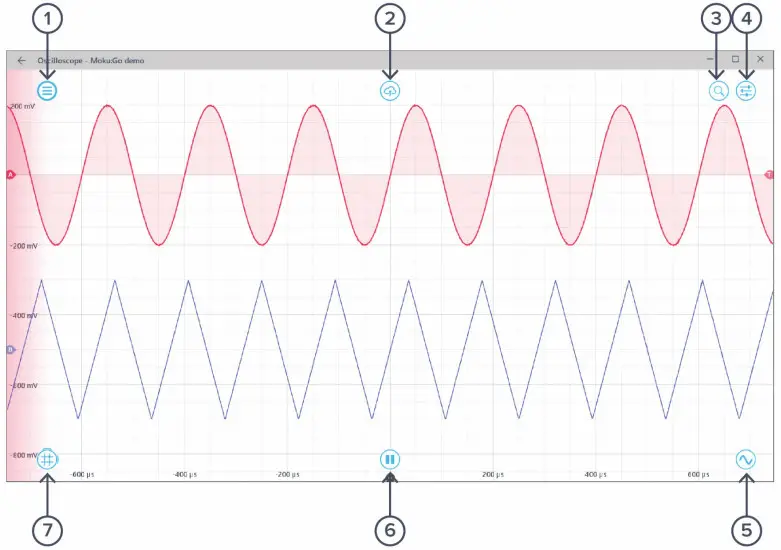
| ID | Description |
| 1 | Main menu |
| 2 | Save data |
| 3 | Signal display navigation |
| 4 | Settings |
| 5 | Waveform Generator |
| 6 | Play/pause |
| 7 | Cursors |
The main menu can be accessed by clicking the ![]() icon on the top-left corner.
icon on the top-left corner.
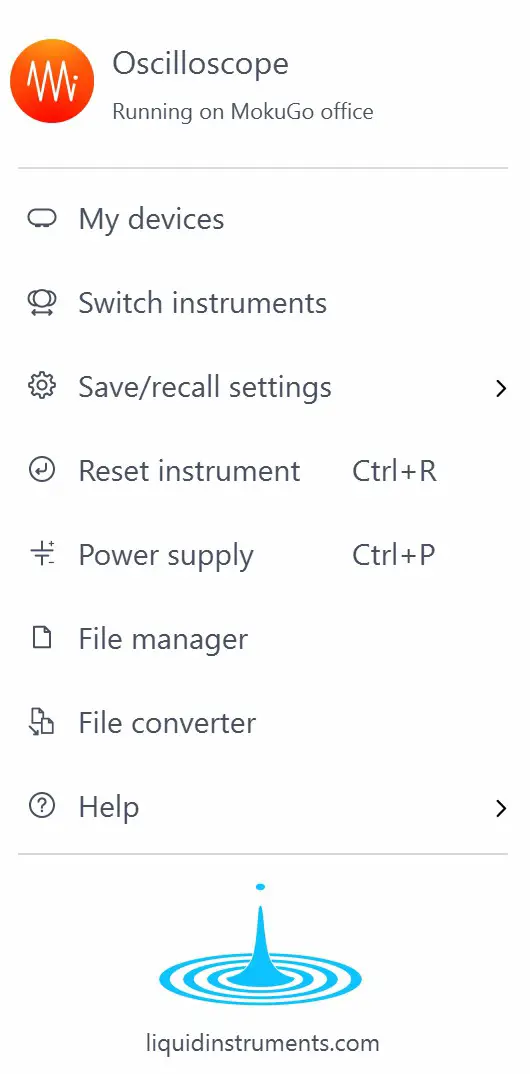
This menu provides the following options:
| Options | Shortcuts | Description |
| My devices | Return to device selection. | |
| Switch instruments | Switch to another instrument. | |
| Save/recall settings: | ||
| • Save instrument state | Ctrl/Cmd+S | Save the current instrument settings. |
| • Load instrument state | Ctrl/Cmd+O | Load the last saved instrument settings. |
| • Show current sate | Show the current instrument settings. | |
| Reset instrument | Ctrl/Cmd+R | Reset the instrument to its default state. |
| Power supply | Access the Power Supply control window.* | |
| File manager | Open the File Manager tool.** | |
| File converter | Open the File Converter tool.** | |
| Help | ||
| • Liquid Instruments website | Access the Liquid Instruments website. | |
| • Shortcuts list | Ctrl/Cmd+H | Show the Moku: Go app shortcuts list. |
| • Manual | Fl | Access the instrument manual. |
| • Report an issue | Report a bug to Liquid Instruments. | |
| • About | Show app version, check update, or license information. |
*Power Supply is available on the Moku: Go M1 and M2 models. Detailed information about the Power Supply can be found on page 24 of this user manual.
**Detailed information about the file manager and file converter can be found on page 22 of this user manual.
Signal display position
The displayed signal can be moved around the screen by clicking anywhere on the signal display window and dragging to a new position. The cursor will turn into a ![]() icon once clicked. Drag horizontally to shift along the time axis and drag vertically to shift along the voltage axis.
icon once clicked. Drag horizontally to shift along the time axis and drag vertically to shift along the voltage axis.
The signal display can also be moved horizontally and vertically with the arrow keys.
Display scale and zoom
The display can be zoomed in and out using the scroll wheel or gesture on your mouse or trackpad. Scrolling will zoom the primary axis, while holding Ctrl/Cmd while scrolling will zoom the secondary axis. You can choose which axis is primary and secondary by clicking the ![]() icon.
icon.
| Icons | Description |
| Set the primary axis to horizontal (time). | |
| Set the primary axis to vertical (voltage). | |
| Rubber band zoom: click and drag left-to-right to zoom in to the selected region. Click and drag right-to-left to zoom out. |
Additional keyboard combinations are also available.
| Actions | Description |
| Ctrl/Cmd + Scroll Wheel | Zoom the secondary axis. |
| +/- | Zoom the primary axis with the keyboard. |
| Ctrl/Cmd +/- | Zoom the secondary axis with the keyboard. |
| Shift + Scroll Wheel | Zoom the primary axis toward the center. |
| Ctrl/Cmd + Shift + Scroll Wheel | Zoom the secondary axis toward the center. |
| R | Rubber band zoom. |
Auto scale
Double-click anywhere on the signal display to auto scale the trace’s vertical (voltage) axis.
Axes and traces
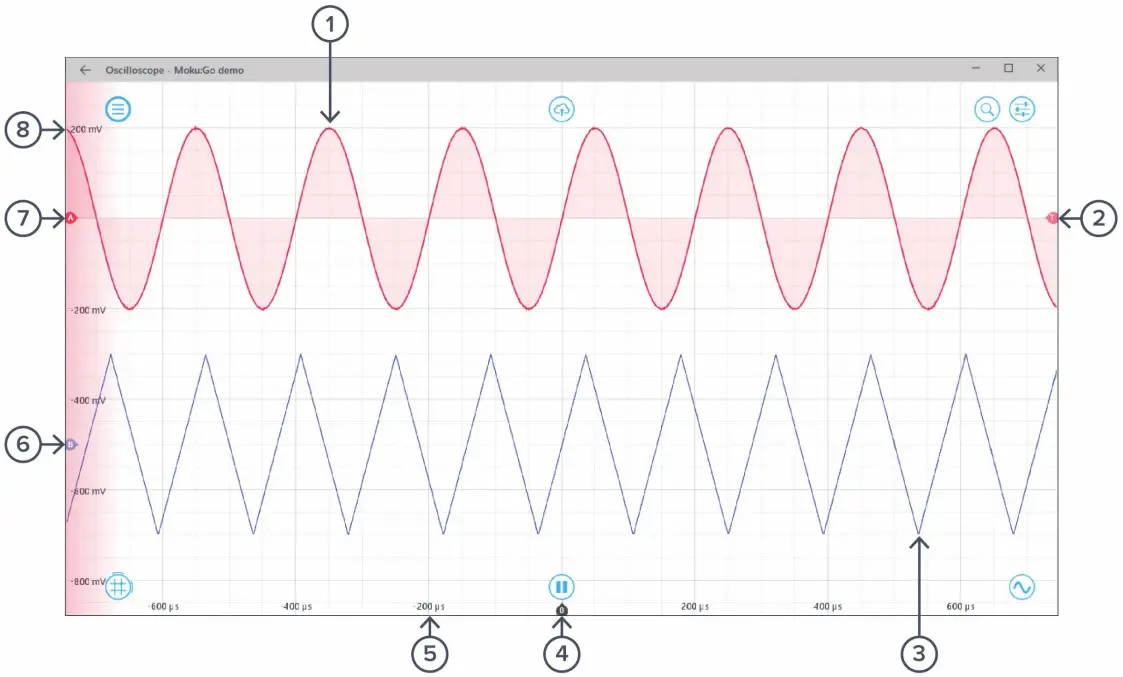
| ID | Button | Description |
| 1 | Channel A Trace | The time/voltage trace for Channel A. When Channel A is active, the trace will have a light red fill to the zero-volt level (as shown). |
| 2 | Trigger Level Mark | Marks the trigger threshold level. Shown against whichever trace is currently set for triggering (if either). |
| 3 | Channel B Trace | The time/voltage trace for Channel B. When Channel B is active, the trace will have a light blue fill to the zero-volt level (not shown above). |
| 4 | Time Origin Mark | Marks the zero-second point on the time scale. This will be the trigger point if the Oscilloscope has triggered. Otherwise, its relationship to the signal is undefined. |
| 5 | Time Axis | Shows the time scale for both channels (the channels always share the same time scale). |
| 6 | Channel B Origin Mark | Marks the zero-voltage level for Channel B. |
| 7 | Channel A Origin Mark | Marks the zero-voltage level for Channel A. |
| 8 | Voltage Axis | Shows the voltage scale for the active channel. The active channel is selected by clicking on the trace and is indicated by the shading of the voltage axis and the trace. |
Right-clicking (secondary clicking) in the signal display area reveals additional options for the active channel. You can switch the active channel, toggle channels on and off, add or remove a reference trace, or save the current display via this menu. Later sections cover options regarding cursors and triggers in detail. 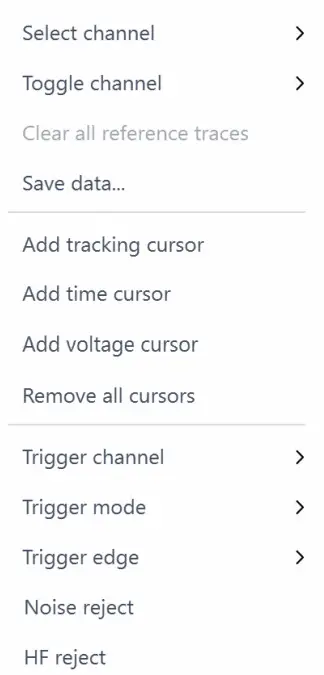
| Options | Description |
| Select channel | Select the active channel. |
| Toggle channel | Turn a channel on/off. |
| Clear all reference traces | Set or clear the reference trace. |
| Save data | Save your data. |
| Add tracking cursor | Add a Tracking Cursor. |
| Add time cursor | Add a Time Cursor. |
| Add voltage cursor | Add a Voltage Cursor. |
| Remove all cursors | Remove all cursors. |
| Trigger channel | Set the trigger channel. |
| Trigger mode | Configure the trigger mode. |
| Trigger edge | Set the rising, falling, or either edge |
| Noise reject | Filter noise on the trigger. |
| HF reject | Reject high frequency on the trigger. |
Right-clicking (secondary clicking) on the channel trace reveals additional options for the active channel. You can switch the active channel, toggle channels on and off, add or remove a reference trace, or save the current display via this menu. Later sections cover options regarding cursors and triggers in detail. 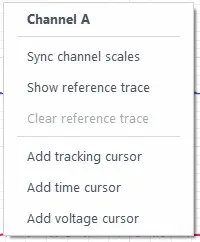
| Options | Description |
| Sync channel scales | Aligns the non-selected channel’s voltage scale with the selected channel’s voltage scale and aligns the zero-voltage points to the same spot. |
| Show reference trace | Captures a reference trace. |
| Clear reference trace | Removes the current reference trace. |
| Add tracking cursor | Add a Tracking Cursor. |
| Add time cursor | Add a Time Cursor. |
| Add voltage cursor | Add a Voltage Cursor. |
Export data
The export data options can be accessed by clicking the ![]() icon, allowing you to:
icon, allowing you to: 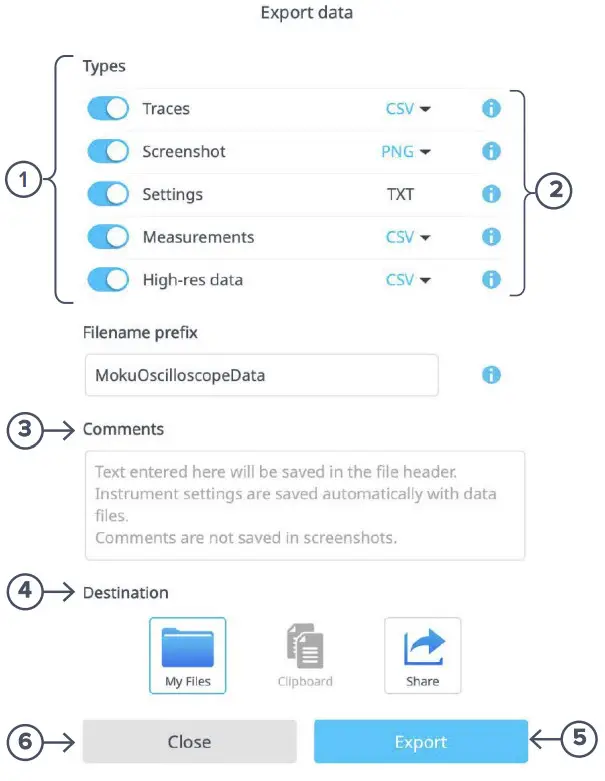
| ID | Description |
| 1 | Select the type of data to export. |
| 2 | Select the export format (e.g., CSV or MAT for traces). |
| 3 | Enter additional comments for the saved file. |
| 4 | Select the export location on your local computer. |
| 5 | Export the data. |
| 6 | Close the export data window. |
Settings
The ![]() icon allows you to reveal or hide the control drawer, giving you access to instrument settings. The drawer contains the channel, time base, trigger, measurement, and voltmeter settings.
icon allows you to reveal or hide the control drawer, giving you access to instrument settings. The drawer contains the channel, time base, trigger, measurement, and voltmeter settings.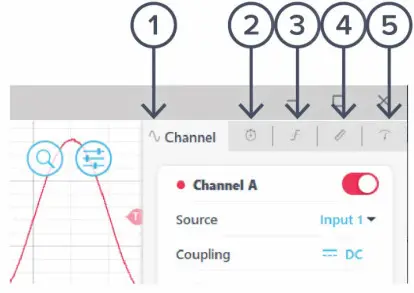
| ID | Description |
| 1 | Channel |
| 2 | Timebase |
| 3 | Trigger |
| 4 | Measurement |
| 5 | Voltmeter |
Channels
The channel pane allows you to change the input settings for each ADC channel, adjust the input scales and coupling, and enable/disable the Math channel. 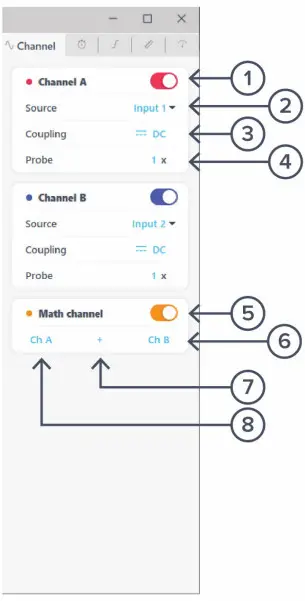
| ID | Button | Description |
| 1 | Channel A | Toggles Channel A on/off. |
| 2 | Channel A source | Changes the data source for Channel A. The default is to view data from Input 1, but Channel A may also view Input 2, Output 1, or Output 2. |
| 3 | Coupling | Toggles between DC/AC coupling. |
| 4 | Probe | Specifies the probe attenuation if an attenuating probe is connected. |
| 5 | Math | Toggles the Math channel on/off. |
| 6 | Math channel source 2 | Second channel in the Math channel calculation. It is not available for certain operations, such as FFT. |
| 7 | Math operations | Detailed explanation about the math operations can be found in the Instrument Reference – Math Operation section. |
| 8 | Math channel source 1 | First channel in the Math channel calculation. |
Timebase 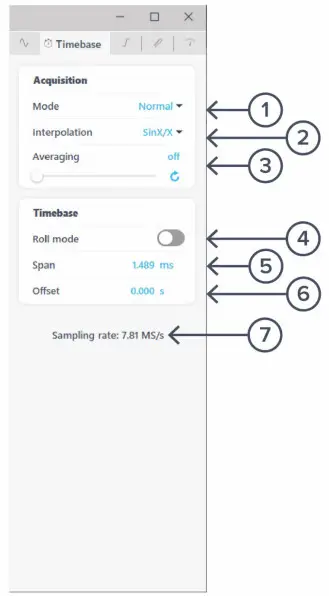
| ID | Button | Description |
| 1 | Acquisition mode | Changes acquisition mode between normal, precision, and peak detect. Detailed information can be found in the Instrument Reference – Acquisition Modes and Sampling section. |
| 2 | Interpolation mode | Change the interpolation mode. Detailed information can be found in the Instrument Reference – Interpolation Mode section. |
| 3 | Averaging | Displays on screen an average trace taken from this many consecutive frames. Click the |
| 4 | Roll-mode toggle | Toggles between roll and sweep modes. See the Display Options section. |
| 5 | Span | Horizontal screen scale. Changes dynamically when zooming in and out along the horizontal axis. |
| 6 | Offset | Horizontal trigger point offset. Changes dynamically when dragging along the horizontal axis. |
| 7 | Sampling rate | Instant sampling rate at the current Timebase setting. Changes dynamically when the span changes. |
Trigger 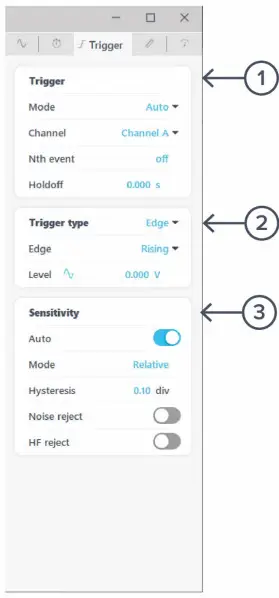
| ID | Button | Description |
| 1 | Trigger settings pane | Mode: Switch between auto, normal, and single trigger modes. See the Navigating your signal section. Channel: Select the source for the trigger circuit. This can be one of the Oscilloscope channels, Moku: Go inputs, or Moku: Go outputs. Nth event: Select up to 65,535 trigger events before triggering the Oscilloscope. Holdoff: The time after a trigger event at which the Oscilloscope will start listening for the next event. |
| 2 | Trigger type | Switch between edge and pulse triggering with selectable levels, edge types, and pulse widths. Click |
| 3 | Sensitivity | Configure auto or manual hysteresis for noise rejection. Configure high frequency (HF) reject to enable a low pass filter on the trigger circuit, giving better noise immunity with a short delay between the trigger event and detection. |
Additional information about the trigger type and sensitivity can be found in the Navigating your signal section.
Measurement
The measurement pane allows you make measurements of frequency, amplitude, or other properties of a channel. A measurement can be made on an input channel, the Math channel, or the difference between any two channels. 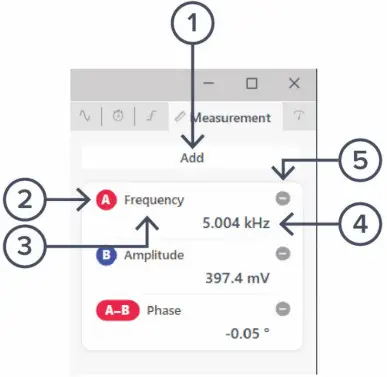
| ID | Description |
| 1 | Add an additional measurement tile. |
| 2 | Measurement source channel. |
| 3 | Measurement type. |
| 4 | Measurement value. |
| 5 | Remove the measurement tile. |
Click a measurement tile to change the measurement properties. The following options are available:
| Options | Description |
| Type | Select the measurement type. Detailed explanation about the measurements can be found in the Making Measurements section. |
| Channels | Select measurement source. |
| Difference Channels | Measure the difference between the measurement source and another channel. |
| Remove | Remove the measurement tile. |
Voltmeter
The voltmeter tiles constantly read the mean voltage levels from input 1 and input 2. They are displayed under this pane. 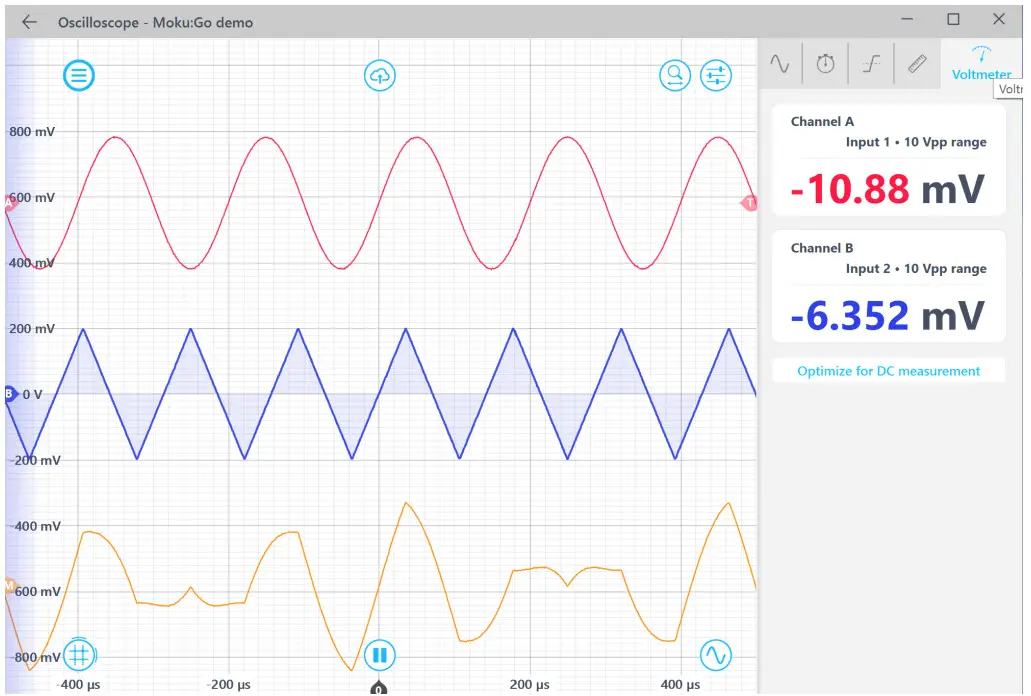
The Optimize for DC measurement button auto-scales each channel’s y-axis such that the entire DC signal is viewable in the signal display area for better mean calculations.
The Voltmeter can display signals with up to 0.1 µV accuracy.
Waveform Generator
The Moku: Go Oscilloscope has a built-in Waveform Generator, which can be opened by clicking ![]() the button. It is capable of generating unmodulated waveforms on the two output channels. Detailed instructions for the Waveform Generator instrument can be found in the Moku: Go Waveform Generator manual.
the button. It is capable of generating unmodulated waveforms on the two output channels. Detailed instructions for the Waveform Generator instrument can be found in the Moku: Go Waveform Generator manual. 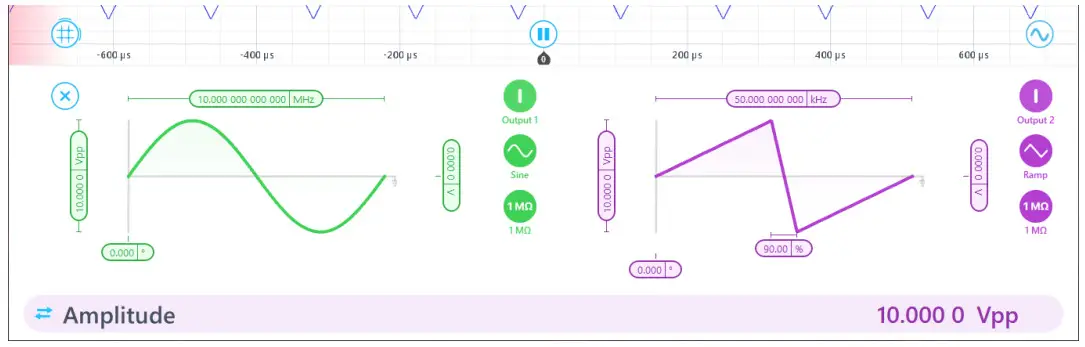
Cursor
The cursors can be accessed by clicking the ![]() icon, allowing you to add a Voltage Cursor or Time Cursor, or remove all cursors. In addition, you can click and drag horizontally to add a Time Curs or, or vertically to add a Voltage Cursor.
icon, allowing you to add a Voltage Cursor or Time Cursor, or remove all cursors. In addition, you can click and drag horizontally to add a Time Curs or, or vertically to add a Voltage Cursor.
User interface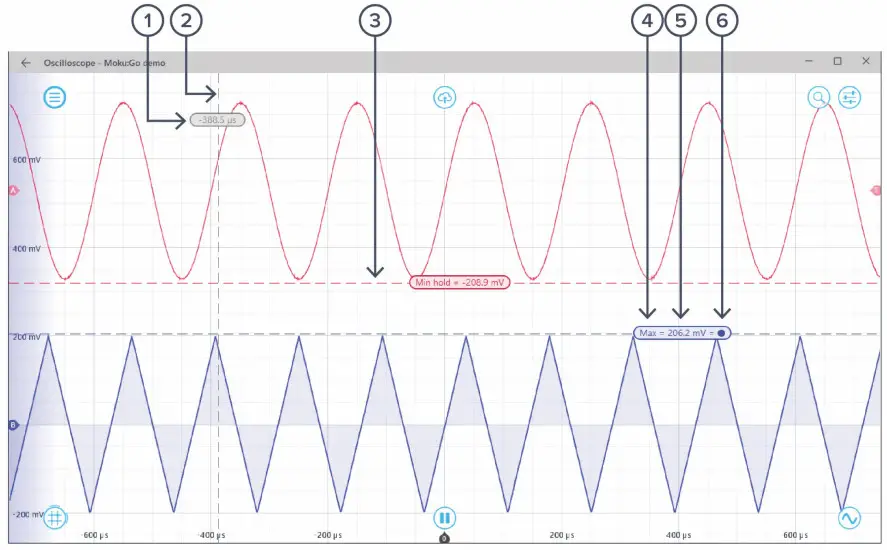
| ID | Parameter | Description |
| 1 | Time reading | Right-click (secondary click) to reveal the Time Cursor options. Drag left or right to set positions. |
| 2 | Time Cursor | The color represents the channel of the measurement (Gray – Unattached, Red – Channel 1, Blue – Channel 2). |
| 3 | Voltage Cursor | Drag up or down to set positions. |
| 4 | Cursor function | Indicates the current cursor function (max, min, max hold, etc.). |
| 5 | Voltage reading | Right-click (secondary click) to reveal the Voltage Cursor options. |
| 6 | Reference indicator | Indicates the cursor is set as reference. All other cursors in the same domain and channel measure the offset to the reference cursor. |
Time Cursor
Right-click (secondary click) to reveal the Time Cursor options: 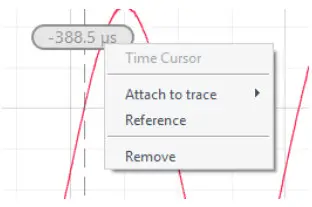
| Options | Description |
| Time Cursor | Cursor type. |
| Attach to trace | Choose to attach the Time Cursor to Input 1 or Input 2. Once the cursor is attached to a channel, it becomes a Tracking Cursor. The Tracking Cursor gives continuous voltage reading at the set time position. |
| Reference | Set the cursor as the reference cursor. |
| Remove | Remove the Time Cursor. |
Tracking Cursor
Right-click (secondary click) to reveal the Tracking Cursor options: ![]()
| Options | Description |
| Tracking Cursor | Cursor type. |
| Channel | Assign the Tracking Cursor to a specific channel. |
| Detach from trace | Detach the Tracking Cursor from the trace to revert to a Time Cursor. |
| Remove | Remove the Tracking Cursor. |
Voltage Cursor
Right-click (secondary click) to reveal the Voltage Cursor options: 
| Options | Description |
| Voltage Cursor | Cursor type. |
| Manual | Manually set the vertical position of the cursor. |
| Track mean | Track the mean voltage. |
| Track maximum | Track the maximum voltage. |
| Track minimum | Track the minimum voltage. |
| Maximum hold | Set the cursor to hold at the maximum voltage level. |
| Minimum hold | Set the cursor to hold at the minimum voltage level. |
| Channel | Assign the Voltage Cursor to a specific channel. |
| Reference | Set the cursor as the reference cursor. |
| Remove | Remove the Voltage Cursor. |
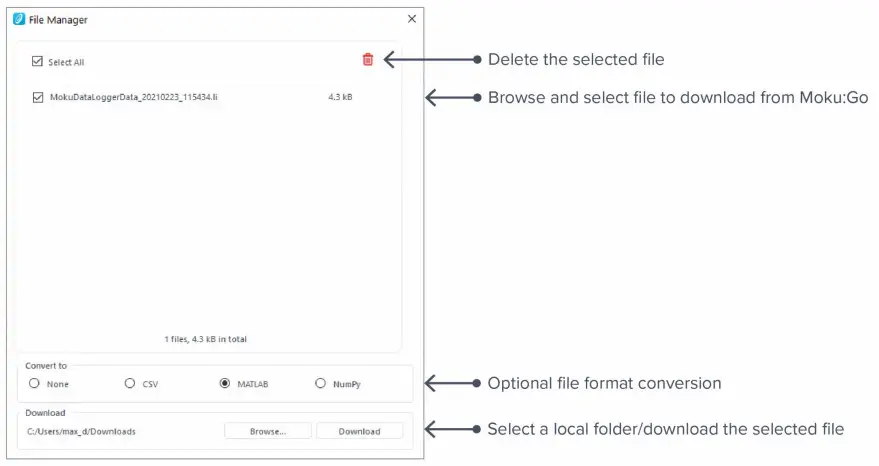
Additional tools
The Moku: Go app has two built-in file management tools: File Manager and File Converter. The File Manager allows you to download the saved data from Moku: Go to the local computer, with optional file format conversion. The File Converter converts the Moku: Go binary (.li) format on the local computer to either .csv, .mat, or .npy format. File Manager
Once a file is transferred to the local computer, a ![]() icon appears next to the file.
icon appears next to the file.
File Converter 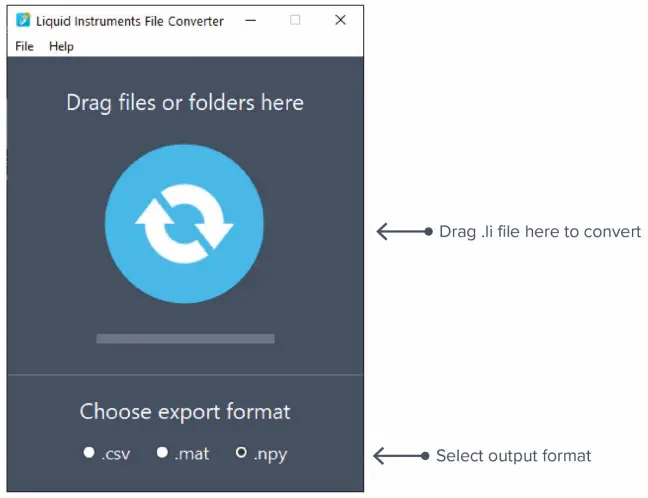
The converted file is saved in the same folder as the original file.
The File Converter has the following menu options:
| Options | Shortcut | Description |
| File | ||
| • Open file | Ctrl/Cmd+O | Select a .li file to convert. |
| • Open folder | Ctrl/Cmd+Shift+O | Select a folder to convert. |
| • Exit | Close the file converter window. | |
| Help | ||
| • Liquid Instruments website | Access the Liquid Instruments website. | |
| • Report an issue | Report a bug to Liquid Instruments. | |
| • About | Show app version or license information. | |
Power Supply
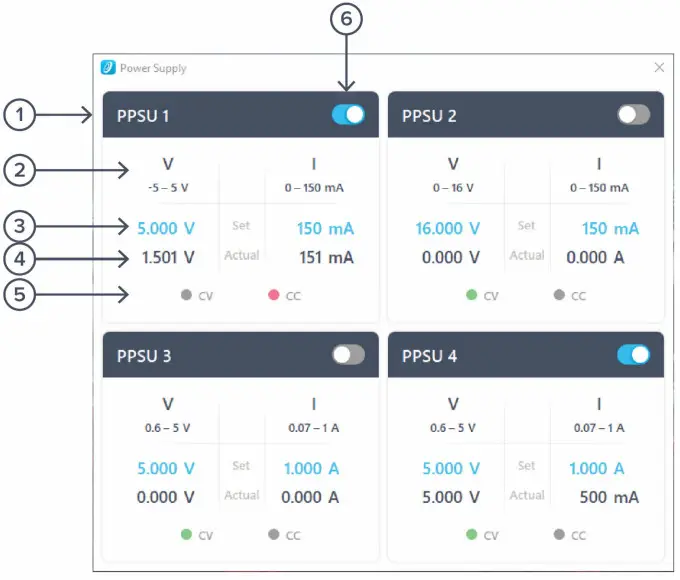
The Moku: Go Power Supply is available on M1 and M2 models. M1 features a two-channel Power Supply, while M2 features a four-channel Power Supply. The Power Supply control window can be accessed in all instruments under the main menu.
Each Power Supply operates in two modes: constant voltage (CV) or constant current (CC) mode. For each channel, you can set a current and voltage limit for the output. Once a load is connected, the Power Supply operates either at the set current or set voltage, whichever comes first. If the Power Supply is voltage limited, it operates in the CV mode. If the Power Supply is current limited, it operates in the CC mode.
| ID | Function | Description |
| 1 | Channel name | Identifies the Power Supply being controlled. |
| 2 | Channel range | Indicates the voltage/current range of the channel. |
| 3 | Set value | Click the blue numbers to set the voltage and current limit. |
| 4 | Readback numbers | Voltage and current readback from the Power Supply; the actual voltage and current being supplied to the external load. |
| 5 | Mode indicator | Indicates if the Power Supply is in CV (green) or CC (red) mode. |
| 6 | On/Off toggle | Click to turn the Power Supply on and off. |
Instrument reference
Configuring inputs
Coupling
Moku: Go includes a switchable AC/DC coupling circuit on each input. This is activated from the channels tab.
For most applications, DC-coupled is the preferred option; this does not filter or modify the signal in any way.
AC-coupled acts as a high pass filter, removing the DC component of the incoming signal (and attenuating other frequency components below the coupling corner). This is useful when you are looking for a small signal on top of a large DC offset. AC coupling is more precise than simply scrolling the trace up the screen, as it may avoid activating the internal attenuator.
Navigating your signal
Trace selection
The Moku: Go Oscilloscope can display up to two signal traces and a math trace. Each signal trace may either be the analog input (default) or a preview of the analog output if the Waveform Generator is active.
To turn a trace on and off, click the switch next to the corresponding trace on the channels tab.
To change the source of a channel, click the Source drop-down box of the channel. Then select between the input channels and output channels.
Triggering
The triggering circuit of the Oscilloscope allows you to indicate what kind of signal event you’re interested in. This event will then be aligned to the zero second mark of the time axis. An event commonly used for triggering are those times when the signal rises or falls past a particular voltage.
These are rising edge and falling edge triggers, respectively. The voltage that the signal must pass is called the trigger level.
Data displayed before the trigger point (negative values on the time axis) is called pre-trigger data; data displayed after the trigger point is called post-trigger data.
In the Oscilloscope, the trigger level is set from the trigger tab, or by dragging the trigger marker on the screen. Other trigger parameters such as the trigger event and the monitored channel are also on this tab.
Trigger modes
Trigger modes describe how the Oscilloscope responds to several trigger events. The options are Auto, Normal, and Single triggering.
Normal trigger mode will only trigger, and therefore update the display, when a trigger event is detected. This is useful if you only care about the signal around the trigger event, but you cannot view the signal in real time without a stream of triggers (e.g., for a DC signal or while setting up the trigger in the first place).
Auto trigger mode acts like Normal; however, if no trigger event has been detected in a short while, it will generate a fake event, causing the display to update. The delay from a real trigger to a fake one is longer than that between fake events, so the signal can be viewed in real time without triggers with enough time to view events around a trigger if one does arrive.
Single trigger captures the first trigger event, then stops acquisition until you start it again. This is useful when you need time to study your signal in detail or to capture a specific signal event for sharing or saving.
Trigger filtering
Often a signal will be noisy. Setting a simple trigger event, such as a rising edge, may cause a trigger event due to noise rather than due to the underlying signal. The Moku: Go Oscilloscope has two features to help reliably trigger on noisy data: noise reject and high-frequency (HF) reject.
Noise reject adds a small amount of hysteresis to the trigger event. This stops the trigger from firing several times as noise repeatedly crosses the trigger threshold; the rising and falling events happen at different levels.
HF reject passes the trigger signal through a lowpass filter before looking for the trigger event. This smooths out the noise, allowing the trigger circuit to observe just the underlying signal. The tradeoff is that this filter introduces some delay in the signal, offsetting the trigger event from the actual data.
Screen update modes
As you zoom out, you will come to a point where the displayed time span is longer than the time between screen updates. In this case, the Oscilloscope will enter one of two update modes: sweep or roll.
Sweep mode
In sweep mode, the screen will only update once a trigger event is received. At this time, the pre-triggered data (all the data before the trigger point) will be updated on the screen. New data will be shown on the screen as it arrives, progressively sweeping across the screen.
This mode is useful when you still require trigger events despite the low data rate.
Roll mode
If roll mode is active, trigger events are ignored. Instead, all new data is displayed on the screen in real time with the most recent data on the right of screen. This causes the trace to roll from right to left continuously.
Use this mode if you want to view all your data in real time and no longer care about aligning the data by trigger.
Making measurements
Automatic measurements
The Oscilloscope can automatically make a number of measurements on your data in real time.
Access automatic measurements in the measurement tab. Add a new measurement by clicking the “Add” button. You can change a measurement by clicking on the measurement tile. The available measurements are:
| Name (unit) | Description |
| Frequency (Hz) | Frequency of the signal as determined by the time between rising or falling edges. |
| Phase | Phase of strongest frequency component with respect to a perfect sine wave. |
| Period (s) | Time between pairs of rising or falling edges. |
| Duty Cycle (%) | Ratio of the time spent above the median to that spent below it. |
| Pulse Width (s) | Time the signal spends above the median. |
| Negative Width (s) | Time the signal spends below the median. |
| Mean (V) | Average value of the signal. |
| RMS (V) | Root-Mean-Square value of the signal. |
| Cycle Mean (V) | Average value of the signal, discounting partial cycles at the beginning and end of the frame. |
| Cycle RMS (V) | Root-Mean-Square value of the signal, discounting partial cycles at the beginning and edge of the frame. |
| Standard Deviation (V) | Mathematical description of the spread of the points in the signal. |
| Peak to Peak (V) | Difference between the highest and lowest voltage in the signal. |
| Amplitude (V) | Difference between the high- and low-level voltage, excluding over- and undershoot. |
| Maximum (V) | Highest voltage in the signal. |
| Minimum (V) | Lowest voltage in the signal. |
| High Level (V) | Highest voltage in the signal, excluding overshoot. |
| Low Level (V) | Lowest voltage in the signal, excluding undershoot. |
| Rise Time (s) | Time taken for the signal to transition from 10% to 90% of the way from minimum to maximum. |
| Fall Time (s) | Time taken for the signal to transition from 90% to 10% from maximum to minimum. |
| Rise Rate (V/s) | Rate at which the signal transitions from 10% to 90% of the way from minimum to maximum. |
| Fall Rate (V/s) | Rate at which the signal transitions from 90% to 10% of the way from minimum to maximum. |
| Overshoot (V) | Distance the signal shoots above the maximum level before settling. |
| Undershoot (V) | Distance the signal shoots below minimum level before settling. |
| Fringe visibility (%) | Contrast of fringes when the input signal is interpreted as an interference pattern. |
Acquisition modes and sampling
The Oscilloscope processes data in two stages. First, data is acquired from the analog-to-digital converters (ADCs), down-sampled, and stored in memory. From there, the data is aligned relative to the trigger point and displayed on the screen.
Both operations require down- or up-sampling of the data (reducing or increasing the total number of data points). The method for doing this can provide increased precision and different aliasing behavior.
Acquisition modes
The acquisition mode refers to the process of capturing the data and storing it in the device’s internal memory. This may require down-sampling, depending on the configured Timebase. The down-sampling algorithm can be selected, and is either Normal, Precision, or Peak Detect.
Normal Mode: Extra data is simply removed from the memory (direct down-sampled). For example, if the ADC is running at 125 MSa/s and the selected time span on the Moku: Go Oscilloscope requires 1 MSa/s, then 124 out of 125 points will be ignored.
This can cause the signal to alias and does not increase the precision of the measurement.
However, it does provide a viewable signal at all timespans and all input frequencies.
Precision Mode: Extra data is averaged to the memory (decimation). For example, if the ADC is running at 125 MSa/s and the selected time span on the Oscilloscope requires 1 MSa/s, then 125 consecutive samples will be averaged to produce one data point in the memory.
This increases precision and prevents aliasing. However, if you have an unsuitable time span selected for the signal, then all points can average to zero (or close to it), making it appear like no signal is present.
A common workflow would be to use normal mode to find the signal and align it as desired, then switch to precision mode to improve the signal quality for measurement.
Peak Detect mode: This mode is similar to Precision Mode, except instead of averaging samples from the high-speed ADC, the peak, or highest and lowest samples, are displayed. This allows you to observe and trigger on short-duration pulses occurring over a longer time frame.
Deep Memory mode: This mode acquires 4 Mpts per trigger, per channel and can be exported by enabling the high-resolution data option in the Export data menu.
Interpolation modes
Once the data is in the memory, it needs to be displayed on the screen. This may require up-sampling. The up-sampling mode can be selected and is either Linear, Sin X/X, or Gaussian.
Linear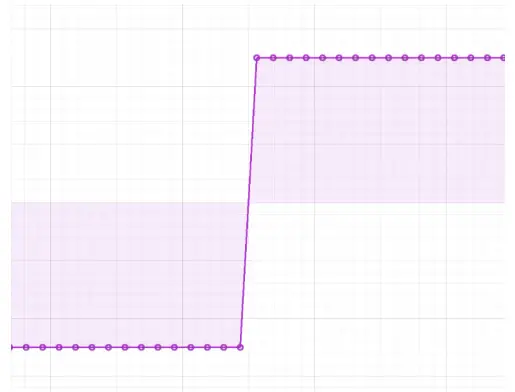
Linear interpolation does not perform any up-sampling. On the display, it marks each point in the original data set and draws a straight line between them. This display does not invent any new data points.
Sin X/X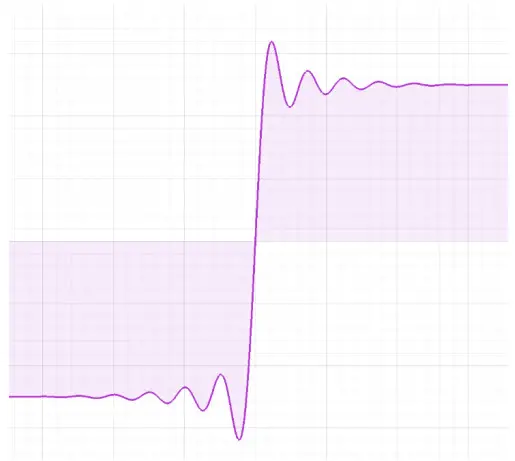 Also called “Sinc” interpolation, this mode preserves the frequency characteristics of the signal. In the time domain, it can appear that there is over- or under-shoot that is not present in the signal.
Use Sin X/X if your signal is sine-like; it does not include significant frequency components that have been removed by filtering or decimation.
Gaussian
Gaussian interpolation smooths the signal out, preserving the visual characteristics of the signal at the expense of frequency information.
Use this mode if your signal is square-like; it contains harmonics or other signal elements that have been removed by filtering or decimation.
Display options
When displaying data on the screen, the Oscilloscope can provide waveform averaging to reduce noise and persistence to catch brief events. Averaging is not exported for either channel or high-resolution data; for more information, see the Export Data section.
Averaging
Drag the slider to average the given number of waveforms on the screen. If the signal is strictly repetitive, this can give you improved precision and noise performance. If it is not repetitive, this mode should not be used.
Math operations
The Oscilloscope can perform real-time math operations on the incoming data and display it as a third channel. The Math channel is different from the measurements above as it is displayed as a trace over time rather than a single value. Measurements can be performed on the Math channel rather than on a physical input channel.
| Operation | Symbol | Description |
| Addition | + | Sum of two channels. |
| Subtraction | – | Difference of two channels. |
| Multiplication | x | Product of two channels. The two channels can be the same, giving a squaring of the signal values. |
| Division | ÷ | Ratio of two channels. |
| XY | XY | Plots a trace whose horizontal axis is not time, but the voltage of the selected channel. |
| Integral | ƒ | Discrete time-integral (running sum) of the trace. |
| Derivative | d/dt | Discrete time-derivative (pointwise difference) of the trace. |
| FFT | FFT | Fast Fourier Transform (FFT) of a trace, giving the frequency domain representation. This mode is complex and described in more detail below. |
| Min Hold | Min hold | Minimum hold. |
| Max Hold | Max hold | Maximum hold. |
| User-entered function | f() | A user-defined math function. |
FFT function
The FFT Math channel shows the frequency-domain representation of the input data. This is useful for quickly checking signals in that domain. In general, you should switch to the Moku: Go Spectrum Analyzer instead, gaining access to advanced features that drastically improve the quality of the measurement.
Limitations of the FFT function of the Oscilloscope include:
- The FFT is subject to aliasing, depending on acquisition mode. The Moku: Go Spectrum Analyzer instrument has an advanced digital signal processing (DSP) anti-aliasing chain, minimizing the effect of unwanted signals.
- The FFT is not windowed. The Spectrum Analyzer provides a range of different windows for minimizing harmonics and spurs, improving amplitude accuracy, and so on.
- The FFT has a fixed frequency resolution set by the time span. The Spectrum Analyzer has a fully configurable Resolution Bandwidth (RBW).
- The FFT span is completely defined by the time span. The Spectrum Analyzer can have any span, providing much more detail around the signal of interest.
Ensure Moku: Go is fully updated. For the latest information, visit:
liquidinstruments.com
Moku: Go Oscilloscope / Voltmeter User Manual
© 2023 Liquid Instruments. All rights reserved.


